OPEN-SOURCE SCRIPT
Long Short Momentum
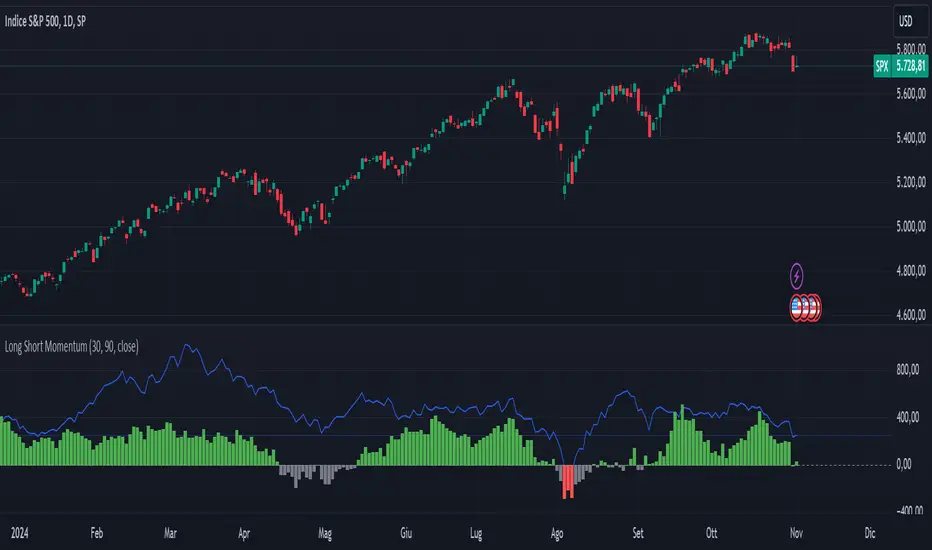
This indicator is designed to visualize short-term and long-term momentum trends.The indicator calculates two momentum lines based on customizable lengths: a short momentum (Short Momentum) over a smaller period and a long momentum (Long Momentum) over a longer period. These lines are plotted relative to the chosen price source, typically the closing price.
The histogram, colored dynamically based on momentum direction, gives visual cues:
The histogram, colored dynamically based on momentum direction, gives visual cues:
- Green: Both short and long momentum are positive, indicating an upward trend.
- Red: Both are negative, indicating a downward trend.
- Gray: Mixed momentum, suggesting potential trend indecision.
오픈 소스 스크립트
트레이딩뷰의 진정한 정신에 따라, 이 스크립트의 작성자는 이를 오픈소스로 공개하여 트레이더들이 기능을 검토하고 검증할 수 있도록 했습니다. 작성자에게 찬사를 보냅니다! 이 코드는 무료로 사용할 수 있지만, 코드를 재게시하는 경우 하우스 룰이 적용된다는 점을 기억하세요.
면책사항
해당 정보와 게시물은 금융, 투자, 트레이딩 또는 기타 유형의 조언이나 권장 사항으로 간주되지 않으며, 트레이딩뷰에서 제공하거나 보증하는 것이 아닙니다. 자세한 내용은 이용 약관을 참조하세요.
오픈 소스 스크립트
트레이딩뷰의 진정한 정신에 따라, 이 스크립트의 작성자는 이를 오픈소스로 공개하여 트레이더들이 기능을 검토하고 검증할 수 있도록 했습니다. 작성자에게 찬사를 보냅니다! 이 코드는 무료로 사용할 수 있지만, 코드를 재게시하는 경우 하우스 룰이 적용된다는 점을 기억하세요.
면책사항
해당 정보와 게시물은 금융, 투자, 트레이딩 또는 기타 유형의 조언이나 권장 사항으로 간주되지 않으며, 트레이딩뷰에서 제공하거나 보증하는 것이 아닙니다. 자세한 내용은 이용 약관을 참조하세요.