PROTECTED SOURCE SCRIPT
Khate ravand
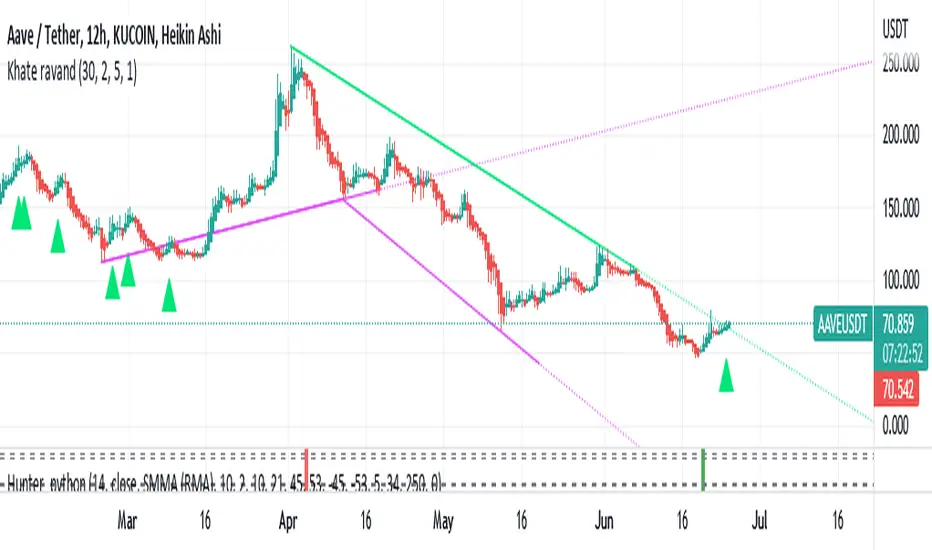
This script draws trendlines from the pivot points in the price chart.
//
// The input for the function that draws the trendlines is any calculation or function
// (here this is pivot points, but the core of the script can be used in other implementations too),
// that most of the time and occasionally produces a 'non n/a' value.
// The trendline function then connects the non n/a values and extends the connections of those points in a trendline.
//
// There is an option to draw the lines from the wicks or from the 'real bodies' of the candles.
// The trendlines can either extend infinitely or only run for an adjustable amount of bars.
//
// There's an option to display trendline breaks
// And the option to display trendlines in color or monochrome
//
//
// The input for the function that draws the trendlines is any calculation or function
// (here this is pivot points, but the core of the script can be used in other implementations too),
// that most of the time and occasionally produces a 'non n/a' value.
// The trendline function then connects the non n/a values and extends the connections of those points in a trendline.
//
// There is an option to draw the lines from the wicks or from the 'real bodies' of the candles.
// The trendlines can either extend infinitely or only run for an adjustable amount of bars.
//
// There's an option to display trendline breaks
// And the option to display trendlines in color or monochrome
//
보호된 스크립트입니다
이 스크립트는 비공개 소스로 게시됩니다. 하지만 이를 자유롭게 제한 없이 사용할 수 있습니다 – 자세한 내용은 여기에서 확인하세요.
면책사항
해당 정보와 게시물은 금융, 투자, 트레이딩 또는 기타 유형의 조언이나 권장 사항으로 간주되지 않으며, 트레이딩뷰에서 제공하거나 보증하는 것이 아닙니다. 자세한 내용은 이용 약관을 참조하세요.
면책사항
해당 정보와 게시물은 금융, 투자, 트레이딩 또는 기타 유형의 조언이나 권장 사항으로 간주되지 않으며, 트레이딩뷰에서 제공하거나 보증하는 것이 아닙니다. 자세한 내용은 이용 약관을 참조하세요.