OPEN-SOURCE SCRIPT
Price Prediction With Rolling Volatility [TradeDots]
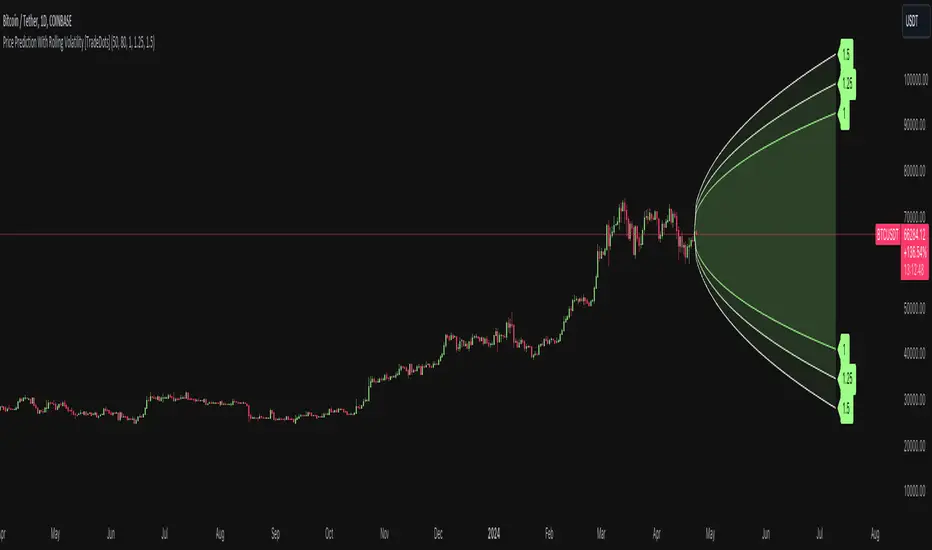
The "Price Prediction With Rolling Volatility" is a trading indicator that estimates future price ranges based on the volatility of price movements within a user-defined rolling window.
HOW DOES IT WORK
This indicator utilizes 3 types of user-provided data to conduct its calculations: the length of the rolling window, the number of bars projecting into the future, and a maximum of three sets of standard deviations.
Firstly, the rolling window. The algorithm amasses close prices from the number of bars determined by the value in the rolling window, aggregating them into an array. It then calculates their standard deviations in order to forecast the prospective minimum and maximum price values.
Subsequently, a loop is initiated running into the number of bars into the future, as dictated by the second parameter, to calculate the maximum price change in both the positive and negative direction.
The third parameter introduces a series of standard deviation values into the forecasting model, enabling users to dictate the volatility or confidence level of the results. A larger standard deviation correlates with a wider predicted range, thereby enhancing the probability factor.
APPLICATION
The purpose of the indicator is to provide traders with an understanding of the potential future movement of the price, demarcating maximum and minimum expected outcomes. For instance, if an asset demonstrates a substantial spike beyond the forecasted range, there's a significantly high probability of that price being rejected and reversed.
However, this indicator should not be the sole basis for your trading decisions. The range merely reflects the volatility within the rolling window and may overlook significant historical price movements. As with any trading strategies, synergize this with other indicators for a more comprehensive and reliable analysis.
Note: In instances where the number of predicted bars is exceedingly high, the lines may become scattered, presumably due to inherent limitations on the TradingView platform. Consequently, when applying three SD in your indicator, it is advised to limit the predicted bars to fewer than 80.
RISK DISCLAIMER
Trading entails substantial risk, and most day traders incur losses. All content, tools, scripts, articles, and education provided by TradeDots serve purely informational and educational purposes. Past performances are not definitive predictors of future results.
오픈 소스 스크립트
트레이딩뷰의 진정한 정신에 따라, 이 스크립트의 작성자는 이를 오픈소스로 공개하여 트레이더들이 기능을 검토하고 검증할 수 있도록 했습니다. 작성자에게 찬사를 보냅니다! 이 코드는 무료로 사용할 수 있지만, 코드를 재게시하는 경우 하우스 룰이 적용된다는 점을 기억하세요.
면책사항
해당 정보와 게시물은 금융, 투자, 트레이딩 또는 기타 유형의 조언이나 권장 사항으로 간주되지 않으며, 트레이딩뷰에서 제공하거나 보증하는 것이 아닙니다. 자세한 내용은 이용 약관을 참조하세요.
오픈 소스 스크립트
트레이딩뷰의 진정한 정신에 따라, 이 스크립트의 작성자는 이를 오픈소스로 공개하여 트레이더들이 기능을 검토하고 검증할 수 있도록 했습니다. 작성자에게 찬사를 보냅니다! 이 코드는 무료로 사용할 수 있지만, 코드를 재게시하는 경우 하우스 룰이 적용된다는 점을 기억하세요.
면책사항
해당 정보와 게시물은 금융, 투자, 트레이딩 또는 기타 유형의 조언이나 권장 사항으로 간주되지 않으며, 트레이딩뷰에서 제공하거나 보증하는 것이 아닙니다. 자세한 내용은 이용 약관을 참조하세요.