OPEN-SOURCE SCRIPT
[OCT] Moving Average Sigmoid Variance
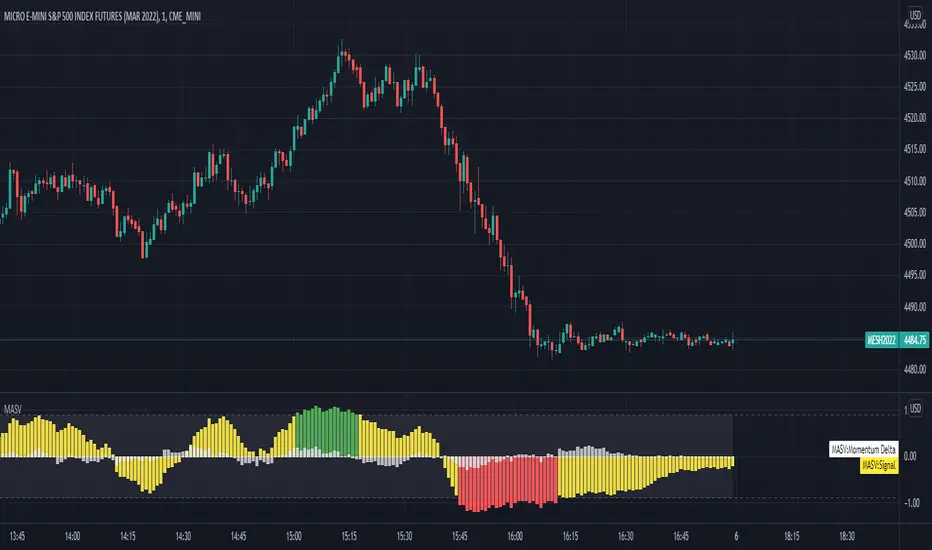
Uses a weighted sigmoid function to gauge the difference between two moving averages. Useful as an additional confirmation source for following trends.
The signal line hovers between -1 and 1, -1 being a negative delta and 1 being a positive delta.
Using a minimum and maximum threshold, a trend can be identified based on how far the signal line crosses the thresholds.
The signal is optionally (enabled by default) adjusted by a "momentum", which is calculated as a moving average of the *change* of a value over time. It's a bit finicky to describe, so please take a look at how it's calculated in code if you wish to use it.
The signal, by default, is green when the value is above the threshold, red when it's below the threshold, and yellow when inside the threshold.
NOTE:
This study is extremely untuned and should not be used as the sole inspiration for taking or exiting a position out of the box.
Please play around with the many available configuration options to fine tune the output to fit your personal strategy.
Configurable options:
- All colors
- All moving average algorithms
- All moving average sources
- All moving average lengths
- Threshold values
- Signal and momentum multipliers
- Whether or not to use the momentum
- Whether or not to plot the momentum
오픈 소스 스크립트
트레이딩뷰의 진정한 정신에 따라, 이 스크립트의 작성자는 이를 오픈소스로 공개하여 트레이더들이 기능을 검토하고 검증할 수 있도록 했습니다. 작성자에게 찬사를 보냅니다! 이 코드는 무료로 사용할 수 있지만, 코드를 재게시하는 경우 하우스 룰이 적용된다는 점을 기억하세요.
면책사항
해당 정보와 게시물은 금융, 투자, 트레이딩 또는 기타 유형의 조언이나 권장 사항으로 간주되지 않으며, 트레이딩뷰에서 제공하거나 보증하는 것이 아닙니다. 자세한 내용은 이용 약관을 참조하세요.
오픈 소스 스크립트
트레이딩뷰의 진정한 정신에 따라, 이 스크립트의 작성자는 이를 오픈소스로 공개하여 트레이더들이 기능을 검토하고 검증할 수 있도록 했습니다. 작성자에게 찬사를 보냅니다! 이 코드는 무료로 사용할 수 있지만, 코드를 재게시하는 경우 하우스 룰이 적용된다는 점을 기억하세요.
면책사항
해당 정보와 게시물은 금융, 투자, 트레이딩 또는 기타 유형의 조언이나 권장 사항으로 간주되지 않으며, 트레이딩뷰에서 제공하거나 보증하는 것이 아닙니다. 자세한 내용은 이용 약관을 참조하세요.