OPEN-SOURCE SCRIPT
업데이트됨 VIX Filter/RSI/EMA Bias/Cum-TICK w/ Exhaustion Zone Dashboard
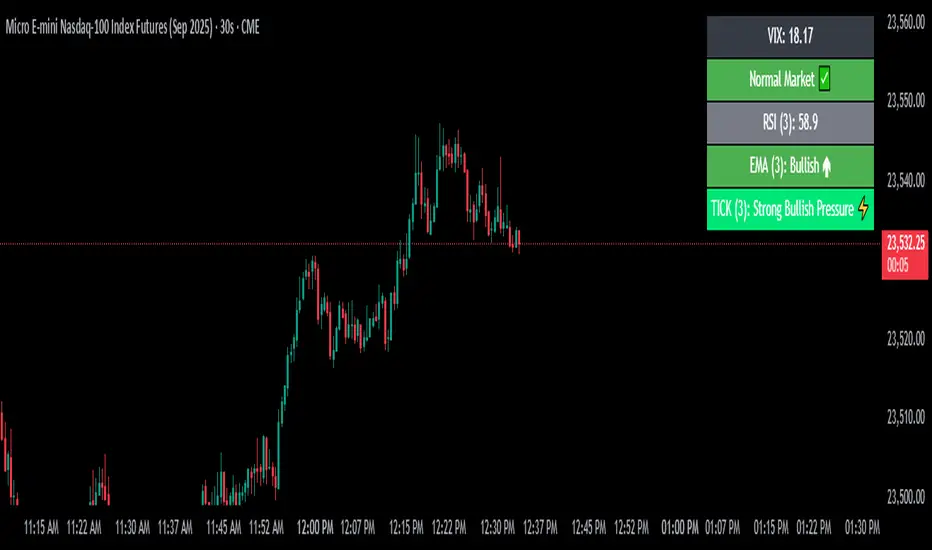
This all-in-one dashboard gives intraday traders a real-time visual read of market conditions, combining volatility regime, trend bias, momentum exhaustion, and internal strength — all in a fully customizable overlay that won’t clutter your chart.
📉 VIX Market Regime Detector
Identifies "Weak", "Normal", "Volatile", or "Danger" market states based on customizable VIX ranges and symbol (e.g., VXN or VIX).
📊 RSI Momentum Readout
Displays real-time RSI from any selected timeframe or symbol, with adjustable length, OB/OS thresholds, and color-coded exhaustion alerts.
📈 EMA Trend Bias Scanner
Compares fast and slow EMAs to define bullish or bearish bias, using your preferred timeframe, symbol, and EMA lengths — ideal for multi-timeframe setups.
🧠 Cumulative TICK Pressure & Exhaustion Engine
Analyzes internal market strength using cumulative TICK data to classify conditions as:
-Strong / Mild Bullish or Bearish Pressure
-Choppy / No Edge
-⚠️ Exhaustion Zones — when raw TICK values hit extreme highs/lows, a separate highlight box appears in the dashboard, warning of potential turning points
All logic is customizable, including TICK symbol, timeframes, thresholds, and lookback periods.
Scalpers and day traders who want fast, visual insight into market internals, exhaustion, and trend bias.
릴리즈 노트
Added a warning icon (⚠️) after the RSI value in the dashboard when RSI is overbought or oversold, complementing the existing color change to make extreme RSI conditions easier to spot릴리즈 노트
⚠️ Added Chart Timeframe Warning: Chart timeframe must be equal to or lower than the selected indicator timeframes (RSI, EMA, TICK, VIX) to ensure accurate readings.오픈 소스 스크립트
트레이딩뷰의 진정한 정신에 따라, 이 스크립트의 작성자는 이를 오픈소스로 공개하여 트레이더들이 기능을 검토하고 검증할 수 있도록 했습니다. 작성자에게 찬사를 보냅니다! 이 코드는 무료로 사용할 수 있지만, 코드를 재게시하는 경우 하우스 룰이 적용된다는 점을 기억하세요.
면책사항
해당 정보와 게시물은 금융, 투자, 트레이딩 또는 기타 유형의 조언이나 권장 사항으로 간주되지 않으며, 트레이딩뷰에서 제공하거나 보증하는 것이 아닙니다. 자세한 내용은 이용 약관을 참조하세요.
오픈 소스 스크립트
트레이딩뷰의 진정한 정신에 따라, 이 스크립트의 작성자는 이를 오픈소스로 공개하여 트레이더들이 기능을 검토하고 검증할 수 있도록 했습니다. 작성자에게 찬사를 보냅니다! 이 코드는 무료로 사용할 수 있지만, 코드를 재게시하는 경우 하우스 룰이 적용된다는 점을 기억하세요.
면책사항
해당 정보와 게시물은 금융, 투자, 트레이딩 또는 기타 유형의 조언이나 권장 사항으로 간주되지 않으며, 트레이딩뷰에서 제공하거나 보증하는 것이 아닙니다. 자세한 내용은 이용 약관을 참조하세요.