OPEN-SOURCE SCRIPT
Clock&Flow MM+Info
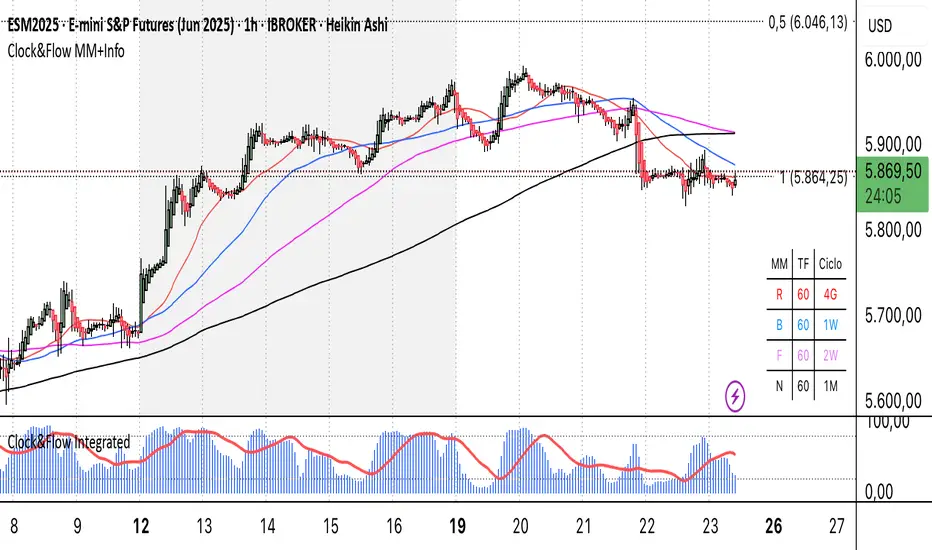
This script is an indicator that helps you visualize various moving averages directly on the price chart and gain some additional insights.
Here's what it essentially does:
Displays Different Moving Averages: You can choose to see groups of moving averages with different periods, set to nominal cyclical durations. You can also opt to configure them for instruments traded with classic or extended trading hours (great for Futures), and they'll adapt to your chosen timeframe.
Colored Bands: It allows you to add colored bands to the background of the chart that change weekly or daily, helping you visualize time cycles. You can customize the band colors.
Information Table: A small table appears in a corner of the chart, indicating which cycle the moving averages belong to (daily, weekly, monthly, etc.), corresponding to the timeframe you are using on the chart.
Customization: You can easily enable or disable the various groups of moving averages or the colored bands through the indicator's settings.
It's a useful tool for traders who use moving averages to identify trends and support/resistance levels, and who want a quick overview of market cycles.
Questo script è un indicatore che aiuta a visualizzare diverse medie mobili direttamente sul grafico dei prezzi e a ottenere alcune informazioni aggiuntive.
In pratica, fa queste cose:
Mostra diverse medie mobili: Puoi scegliere di vedere gruppi di medie mobili con periodi diversi impostati sulle durate cicliche nominali. Puoi scegliere se impostarle per uno strumento quotato con orario di negoziazione classico o esteso (ottimo per i Futures) e si adattano al tuo timeframe).
Bande colorate: Ti permette di aggiungere delle bande colorate sullo sfondo del grafico che cambiano ogni settimana o ogni giorno, per aiutarti a visualizzare i cicli temporali. Puoi scegliere il colore delle bande.
Tabella informativa: In un angolo del grafico, compare una piccola tabella che indica a quale ciclo appartengono le medie mobili (giornaliero, settimanale, mensile, ecc.) e corrispondono in base al timeframe che stai usando sul grafico.
Personalizzazione: Puoi facilmente attivare o disattivare i vari gruppi di medie mobili o le bande colorate tramite le impostazioni dell'indicatore.
È uno strumento utile per i trader che usano le medie mobili per identificare trend e supporti/resistenze, e che vogliono avere un colpo d'occhio sui cicli di mercato.
오픈 소스 스크립트
트레이딩뷰의 진정한 정신에 따라, 이 스크립트의 작성자는 이를 오픈소스로 공개하여 트레이더들이 기능을 검토하고 검증할 수 있도록 했습니다. 작성자에게 찬사를 보냅니다! 이 코드는 무료로 사용할 수 있지만, 코드를 재게시하는 경우 하우스 룰이 적용된다는 점을 기억하세요.
면책사항
해당 정보와 게시물은 금융, 투자, 트레이딩 또는 기타 유형의 조언이나 권장 사항으로 간주되지 않으며, 트레이딩뷰에서 제공하거나 보증하는 것이 아닙니다. 자세한 내용은 이용 약관을 참조하세요.
오픈 소스 스크립트
트레이딩뷰의 진정한 정신에 따라, 이 스크립트의 작성자는 이를 오픈소스로 공개하여 트레이더들이 기능을 검토하고 검증할 수 있도록 했습니다. 작성자에게 찬사를 보냅니다! 이 코드는 무료로 사용할 수 있지만, 코드를 재게시하는 경우 하우스 룰이 적용된다는 점을 기억하세요.
면책사항
해당 정보와 게시물은 금융, 투자, 트레이딩 또는 기타 유형의 조언이나 권장 사항으로 간주되지 않으며, 트레이딩뷰에서 제공하거나 보증하는 것이 아닙니다. 자세한 내용은 이용 약관을 참조하세요.