INVITE-ONLY SCRIPT
업데이트됨 [HuD] Master
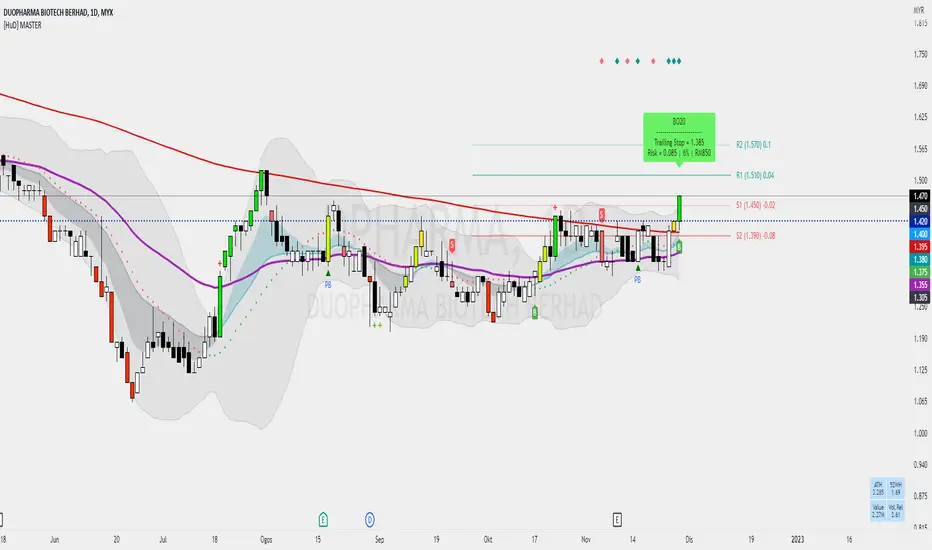
Master is a trend indicator that uses Bollinger Band (BB) and Exponential Moving Average ( EMA ) as its main components.
1️⃣ Two EMA lines are used to create the band, which are EMA 8 and EMA 21
When EMA 8 value > EMA21 value, the band color is filled with green and when EMA 8 < EMA21, band is grey
Green means uptrend mode and grey downtrend mode.
2️⃣ EMA50 (purple color)
EMA50 act as a trend indicator, which indicates whether the chart is uptrend or downtrend
3️⃣ Simple Moving Average (SMA200), red line act as a long-term trend guide.
Chart is in strong uptrend when candles are above EMA50 and SMA200
4️⃣ There are 5 signals generated that act as signals to help traders (Bursa Malaysia) in making decisions for Long position.
🔸BUY Signal (B) and SELL (S)
- generated using ATR with default setting set to, ATR Length = 20 , and ATR Multification = 1.7
- trader can make Buy position from that candle or monitor and enter enter after few candle after BUY Signal
- SELL (S) signal is exit signal = red candle, when it break ATR Trailing stop
🔸PB Signal
- signal generated using Stochastic and when candle rebound from EMA10, EMA20 and EMA50
- this is the most safest Entry since it nearest to support area
🔸BO5 ( Light Green Candle )
- When candle breakout the highest previous five candles with significant volume
- Indicates that there's a sign of interest in buying power in the market
- Another opportunity to enter the market either at the current candle or wait for the right time when it retraces
🔸BO20 ( Green Candle )
- When candle breakout the highest previous twenty candles with significant volume
- In daily chart this candle is consider very important as it is the highest monthly candle.
v. ATOM ( Yellow Candle )
- when candle able to break the LineAtom
- LineAtom = sma (close, 20) + (1 * stdev(close, 20))
- ATOM candle indicates there is momentum for candle to move forward towards Top BB
5️⃣ Other Features from Indicator :
🔹Built-in Gann Lines
- Gann Lines is generated from the calculation and reference of Gann Square 9 Table
- It act as a guide for support and resistance .
- Exit position when it breaks the support or as Take Profit (TP) when it reaches the desired resistance.
🔹Tables
- showing the value of All Time High and 52-Week-High
- show the estimation value of current trade ( volume * close price )
- show the value of volume relative
🔹Golden Cross and Death Cross
- act as guide when there's a crossing between short EMA and long EMA lines
- Below are pair of EMAs used :
🔘EMA5 and EMA20
🔘EMA20 and EMA50
🔘EMA50 and SMA200
릴리즈 노트
- Minor Update and Updated to V5릴리즈 노트
Gann Lines Adjustment :Solid Line = Stronger Resistance/Support
Dashed Line = Resistance/Support
초대 전용 스크립트
이 스크립트는 작성자가 승인한 사용자만 접근할 수 있습니다. 사용하려면 요청 후 승인을 받아야 하며, 일반적으로 결제 후에 허가가 부여됩니다. 자세한 내용은 아래 작성자의 안내를 따르거나 Hud_Hud에게 직접 문의하세요.
트레이딩뷰는 스크립트의 작동 방식을 충분히 이해하고 작성자를 완전히 신뢰하지 않는 이상, 해당 스크립트에 비용을 지불하거나 사용하는 것을 권장하지 않습니다. 커뮤니티 스크립트에서 무료 오픈소스 대안을 찾아보실 수도 있습니다.
작성자 지시 사항
Indicator only act as guides for traders.
면책사항
해당 정보와 게시물은 금융, 투자, 트레이딩 또는 기타 유형의 조언이나 권장 사항으로 간주되지 않으며, 트레이딩뷰에서 제공하거나 보증하는 것이 아닙니다. 자세한 내용은 이용 약관을 참조하세요.