OPEN-SOURCE SCRIPT
Chande Volatility-Based Trailing Stops
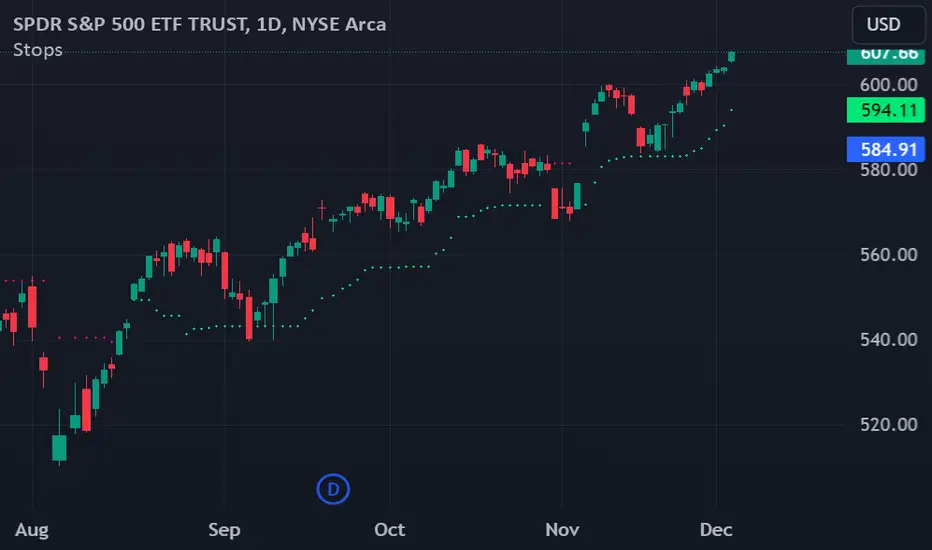
This indicator is developed from a description outlined in the Chande - Kroll book, "The New Technical Trader". It is designed to help control risk by plotting two lines that function as long and short trailing stops.
How does it work?
"These stops are derived from recent highest high or lowest low. They adjust based on volatility. However, to avoid giving up a sizable chunk of profit before the stop is hit, it is modified in such a way that the stop can only advance with price, not retreat. This will lock in a greater portion of potential profits..."
Settings:
The default settings are those described in the book. They are described as being best for intermediate term trades. Use the multiplier to tighten or loosen the stop. A smaller multiplier will result in tighter stops. It is recommended to adjust this value for your preferred timeframe. You can toggle the trailing stop lines on or off as well as cross over marker.
오픈 소스 스크립트
트레이딩뷰의 진정한 정신에 따라, 이 스크립트의 작성자는 이를 오픈소스로 공개하여 트레이더들이 기능을 검토하고 검증할 수 있도록 했습니다. 작성자에게 찬사를 보냅니다! 이 코드는 무료로 사용할 수 있지만, 코드를 재게시하는 경우 하우스 룰이 적용된다는 점을 기억하세요.
면책사항
해당 정보와 게시물은 금융, 투자, 트레이딩 또는 기타 유형의 조언이나 권장 사항으로 간주되지 않으며, 트레이딩뷰에서 제공하거나 보증하는 것이 아닙니다. 자세한 내용은 이용 약관을 참조하세요.
오픈 소스 스크립트
트레이딩뷰의 진정한 정신에 따라, 이 스크립트의 작성자는 이를 오픈소스로 공개하여 트레이더들이 기능을 검토하고 검증할 수 있도록 했습니다. 작성자에게 찬사를 보냅니다! 이 코드는 무료로 사용할 수 있지만, 코드를 재게시하는 경우 하우스 룰이 적용된다는 점을 기억하세요.
면책사항
해당 정보와 게시물은 금융, 투자, 트레이딩 또는 기타 유형의 조언이나 권장 사항으로 간주되지 않으며, 트레이딩뷰에서 제공하거나 보증하는 것이 아닙니다. 자세한 내용은 이용 약관을 참조하세요.