OPEN-SOURCE SCRIPT
Inside Candle by Harshini
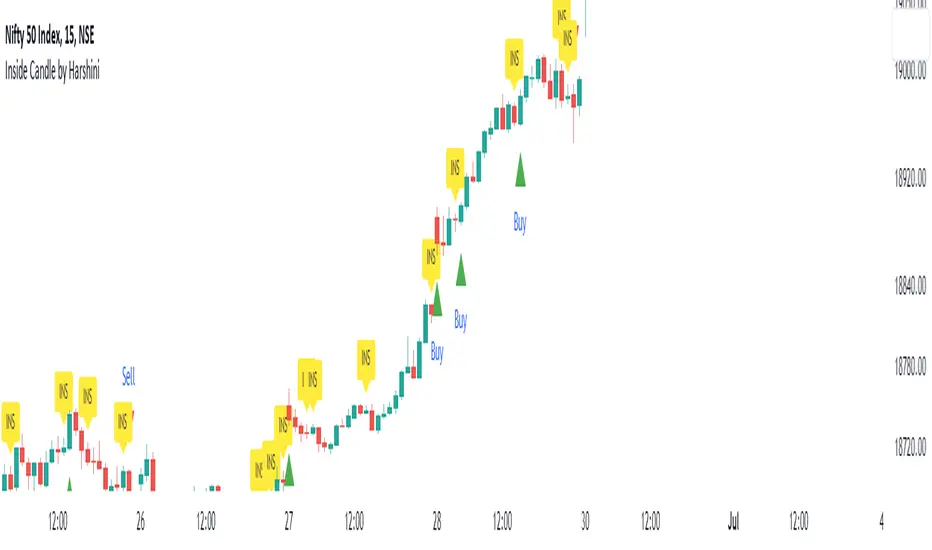
The concept behind this indicator is that the inside candle indicates a pause in the current move and the following candle after inside candle will indicate the direction of the next move. This indicator informs you when an inside candle is formed and based on the next candle, it gives you buy/sell signal.
When an inside candle is formed, a label will appear above the candle, which makes it very easy to identify the inside candle in live charts. Once the inside candle is formed, the Buy/Sell signal depends on the next candle. If the candle formed after the inside candle gives a breakout above then "Buy" signal is indicated, you can take a trade with 1:2 risk reward. Similarly if the next candle gives a breakout below, then a "Sell" signal is generated and you can take a sell with 1:2 risk reward. This indicator can be applied to any chart like stocks, crypto, commodities etc...
Here's how you can trade using this indicator:
1) Apply this indicator in a 15 mins time frame :
Even though this indicator identifies inside candle formation in almost every time frame, it works very well when applied to a 15 mins chart.
2) Always keep minimum 1:2 Risk Reward :
While taking trades initially, stick on to 1:2 risk reward. If there are other confluences as well along with the inside candle, you can book target accordingly.
Note : It is observed that this indicator works well in a trending market and not in ranging bound market.
오픈 소스 스크립트
트레이딩뷰의 진정한 정신에 따라, 이 스크립트의 작성자는 이를 오픈소스로 공개하여 트레이더들이 기능을 검토하고 검증할 수 있도록 했습니다. 작성자에게 찬사를 보냅니다! 이 코드는 무료로 사용할 수 있지만, 코드를 재게시하는 경우 하우스 룰이 적용된다는 점을 기억하세요.
면책사항
해당 정보와 게시물은 금융, 투자, 트레이딩 또는 기타 유형의 조언이나 권장 사항으로 간주되지 않으며, 트레이딩뷰에서 제공하거나 보증하는 것이 아닙니다. 자세한 내용은 이용 약관을 참조하세요.
오픈 소스 스크립트
트레이딩뷰의 진정한 정신에 따라, 이 스크립트의 작성자는 이를 오픈소스로 공개하여 트레이더들이 기능을 검토하고 검증할 수 있도록 했습니다. 작성자에게 찬사를 보냅니다! 이 코드는 무료로 사용할 수 있지만, 코드를 재게시하는 경우 하우스 룰이 적용된다는 점을 기억하세요.
면책사항
해당 정보와 게시물은 금융, 투자, 트레이딩 또는 기타 유형의 조언이나 권장 사항으로 간주되지 않으며, 트레이딩뷰에서 제공하거나 보증하는 것이 아닙니다. 자세한 내용은 이용 약관을 참조하세요.