OPEN-SOURCE SCRIPT
Early Relative Volume
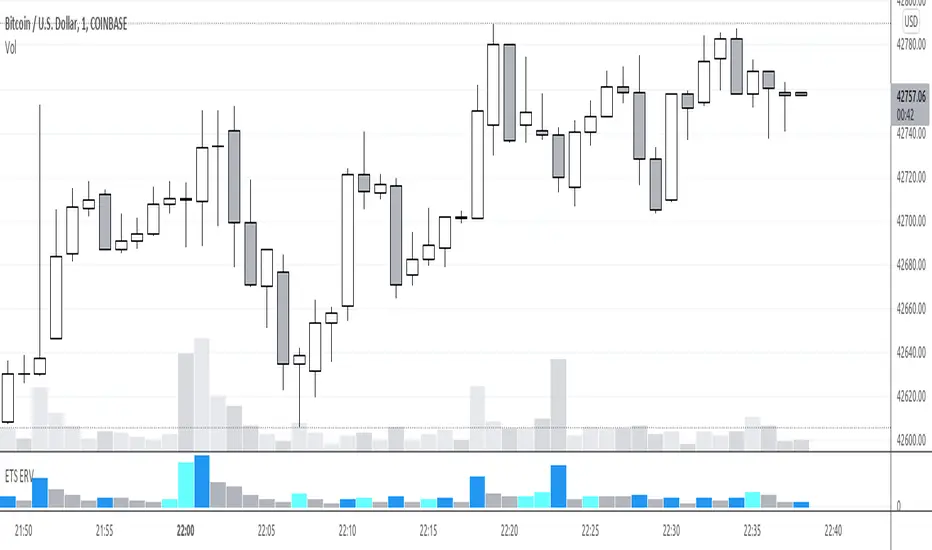
"Buy or Sell when you see a spike in volume" is advice that you often hear, the problem for me was that you only find out that volume is spiking after the fact. So that's why I created the Early Relative Volume indicator.
The Early Relative Volume indicator takes the amount of time that has passed for the current bar, let's say 10 seconds, and compares the volume of that first 10 seconds to the average volume in 10 seconds of the previous candle.
That means that it will tell you if the volume thus far in the current candle is more or less than the relative volume of the previous candle, so that you can potentially get an indication that the volume of the current candle is going to be greater or less than the previous candle.
This approach is of course not perfect, and obviously the values update as the current candle progresses, but I've found it useful to identify early breakout candles.
There is also an option to do the same calculation with the size of the body of the candle, by enabling the "Blue bars if candle body and volume bigger" option. It will only turn blue of both the volume and the size of the candle's body is calculated to be bigger.
I hope this helps you in your trading!
오픈 소스 스크립트
트레이딩뷰의 진정한 정신에 따라, 이 스크립트의 작성자는 이를 오픈소스로 공개하여 트레이더들이 기능을 검토하고 검증할 수 있도록 했습니다. 작성자에게 찬사를 보냅니다! 이 코드는 무료로 사용할 수 있지만, 코드를 재게시하는 경우 하우스 룰이 적용된다는 점을 기억하세요.
Doing what I can to help people trade better. Past performance doesn't guarantee future results. Trade at your own risk. This is not financial advice, it is personal opinion, I'm not a financial adviser. I may have a stake in what I write about.
면책사항
해당 정보와 게시물은 금융, 투자, 트레이딩 또는 기타 유형의 조언이나 권장 사항으로 간주되지 않으며, 트레이딩뷰에서 제공하거나 보증하는 것이 아닙니다. 자세한 내용은 이용 약관을 참조하세요.