PROTECTED SOURCE SCRIPT
GFM Analyst 01 - Price Action & EMAs
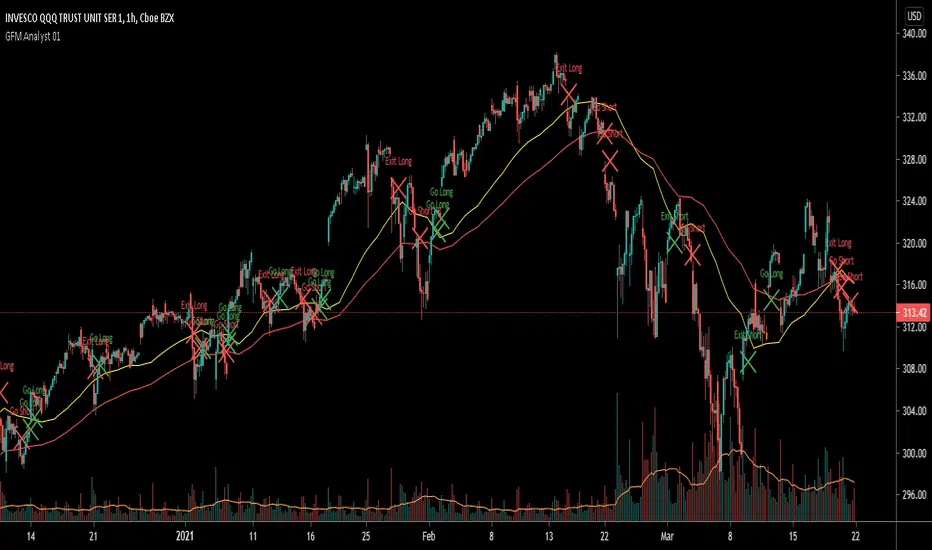
This indicator will help in identifying trends. It is using the historic price action to determine the Buy and Sell signals.
Also we have used the Exponential Moving Averages on a daily timeframe (resolution/period). This will help is eradicate any false signals.
Yellow Line = Fast Exponential Moving Average
Red Line = Slow Exponential Moving Average
On a shorter timeframe, one should ignore short signals, if the price is moving above these two EMA's and similarly ignore long signals, if the price is moving below these two EMA's.
보호된 스크립트입니다
이 스크립트는 비공개 소스로 게시됩니다. 하지만 이를 자유롭게 제한 없이 사용할 수 있습니다 – 자세한 내용은 여기에서 확인하세요.
면책사항
해당 정보와 게시물은 금융, 투자, 트레이딩 또는 기타 유형의 조언이나 권장 사항으로 간주되지 않으며, 트레이딩뷰에서 제공하거나 보증하는 것이 아닙니다. 자세한 내용은 이용 약관을 참조하세요.
보호된 스크립트입니다
이 스크립트는 비공개 소스로 게시됩니다. 하지만 이를 자유롭게 제한 없이 사용할 수 있습니다 – 자세한 내용은 여기에서 확인하세요.
면책사항
해당 정보와 게시물은 금융, 투자, 트레이딩 또는 기타 유형의 조언이나 권장 사항으로 간주되지 않으며, 트레이딩뷰에서 제공하거나 보증하는 것이 아닙니다. 자세한 내용은 이용 약관을 참조하세요.