PROTECTED SOURCE SCRIPT
VR1 DEMA
Sure, here's a description for the "Volume Range Dual EMA" indicator:
---
**Indicator Name:** Volume Range Dual EMA
**Description:**
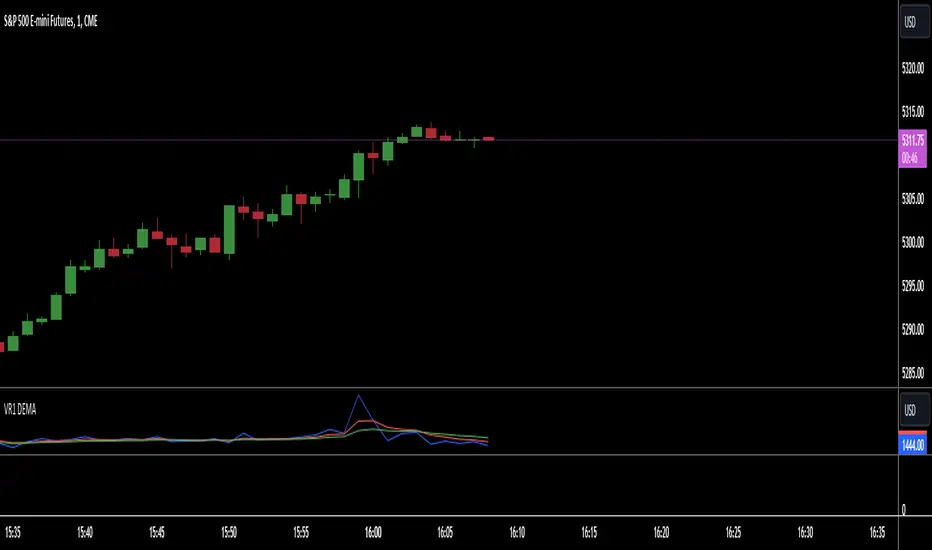
The "Volume Range Dual EMA" indicator is a technical analysis tool designed for TradingView charts. It calculates the ratio of volume to the price range of each bar and plots two Exponential Moving Averages (EMAs) of this ratio.
**Usage:**
- This indicator helps traders analyze the relationship between volume and price range in a given timeframe.
- The primary purpose of the indicator is to identify trends and potential changes in market sentiment based on volume and price movements.
- Traders can adjust the lengths of the EMAs according to their trading strategies and preferences.
- When the shorter EMA crosses above the longer EMA, it may signal a bullish trend, whereas a crossover in the opposite direction could indicate a bearish trend.
**Parameters:**
1. **EMA Length 1:** Defines the length of the first Exponential Moving Average (EMA) used in the calculation.
2. **EMA Length 2:** Defines the length of the second Exponential Moving Average (EMA) used in the calculation.
---
**Indicator Name:** Volume Range Dual EMA
**Description:**
The "Volume Range Dual EMA" indicator is a technical analysis tool designed for TradingView charts. It calculates the ratio of volume to the price range of each bar and plots two Exponential Moving Averages (EMAs) of this ratio.
**Usage:**
- This indicator helps traders analyze the relationship between volume and price range in a given timeframe.
- The primary purpose of the indicator is to identify trends and potential changes in market sentiment based on volume and price movements.
- Traders can adjust the lengths of the EMAs according to their trading strategies and preferences.
- When the shorter EMA crosses above the longer EMA, it may signal a bullish trend, whereas a crossover in the opposite direction could indicate a bearish trend.
**Parameters:**
1. **EMA Length 1:** Defines the length of the first Exponential Moving Average (EMA) used in the calculation.
2. **EMA Length 2:** Defines the length of the second Exponential Moving Average (EMA) used in the calculation.
보호된 스크립트입니다
이 스크립트는 비공개 소스로 게시됩니다. 하지만 제한 없이 자유롭게 사용할 수 있습니다 — 여기에서 자세히 알아보기.
면책사항
이 정보와 게시물은 TradingView에서 제공하거나 보증하는 금융, 투자, 거래 또는 기타 유형의 조언이나 권고 사항을 의미하거나 구성하지 않습니다. 자세한 내용은 이용 약관을 참고하세요.
보호된 스크립트입니다
이 스크립트는 비공개 소스로 게시됩니다. 하지만 제한 없이 자유롭게 사용할 수 있습니다 — 여기에서 자세히 알아보기.
면책사항
이 정보와 게시물은 TradingView에서 제공하거나 보증하는 금융, 투자, 거래 또는 기타 유형의 조언이나 권고 사항을 의미하거나 구성하지 않습니다. 자세한 내용은 이용 약관을 참고하세요.