OPEN-SOURCE SCRIPT
Auto-Anchored MA with Deviation Bands
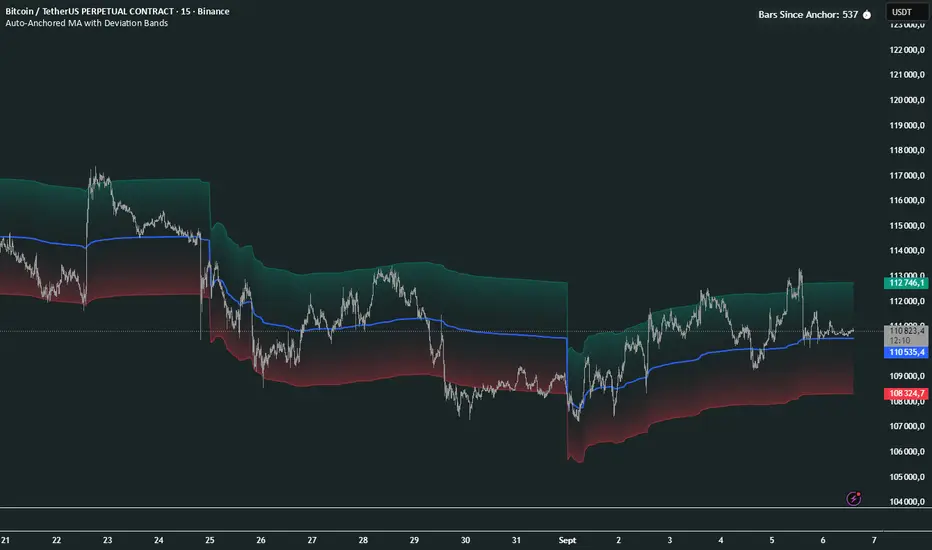
Auto-Anchored MA with Deviation Bands
✨ Features
📈 Auto-Anchored MA: Calculates moving averages (EMA, SMA, EWMA, WMA, VWAP, TEMA) anchored to user-defined periods (Hour, Day, Week, etc.).📏 Deviation Bands: Plots upper/lower bands using Percentage or Standard Deviation modes for volatility analysis.⚙️ Customizable Timeframes: Choose anchor periods from Hour to Year for flexible trend analysis.🎨 Visuals: Displays MA and bands with gradient fills, customizable colors, and adjustable display bars.⏱️ Countdown Table: Shows bars since the last anchor for easy tracking.🛠️ Smoothing: Applies smoothing to bands for cleaner visuals.
🛠️ How to Use
Add to Chart: Apply the indicator on TradingView.
Configure Inputs:
Anchor Settings: Select anchor period (e.g., Day, Week).
MA Settings: Choose MA type (e.g., VWAP, TEMA).
Deviation Settings: Set deviation mode (Percentage/Std Dev) and multipliers.
Display Settings: Adjust bars to display, colors, and gradient fill.
Analyze: View MA, deviation bands, and countdown table on the chart.
Track Trends: Use bands as dynamic support/resistance and monitor anchor resets.
🎯 Why Use It?
Dynamic Analysis: Auto-anchors MA to key timeframes for adaptive trend tracking.
Volatility Insight: Deviation bands highlight potential breakouts or reversals.
Customizable: Tailor MA type, timeframe, and visuals to your trading style.
User-Friendly: Clear visuals and countdown table simplify analysis.
📝 Notes
Ensure sufficient bars for accurate MA and deviation calculations.
Gradient fill enhances readability but can be disabled for simplicity.
Best used with complementary indicators like RSI or Bollinger Bands for robust strategies.
Happy trading! 🚀📈
오픈 소스 스크립트
트레이딩뷰의 진정한 정신에 따라, 이 스크립트의 작성자는 이를 오픈소스로 공개하여 트레이더들이 기능을 검토하고 검증할 수 있도록 했습니다. 작성자에게 찬사를 보냅니다! 이 코드는 무료로 사용할 수 있지만, 코드를 재게시하는 경우 하우스 룰이 적용된다는 점을 기억하세요.
My Website for the traders !
면책사항
해당 정보와 게시물은 금융, 투자, 트레이딩 또는 기타 유형의 조언이나 권장 사항으로 간주되지 않으며, 트레이딩뷰에서 제공하거나 보증하는 것이 아닙니다. 자세한 내용은 이용 약관을 참조하세요.