OPEN-SOURCE SCRIPT
업데이트됨 SL - 4 EMAs, 2 SMAs & Crossover Signals
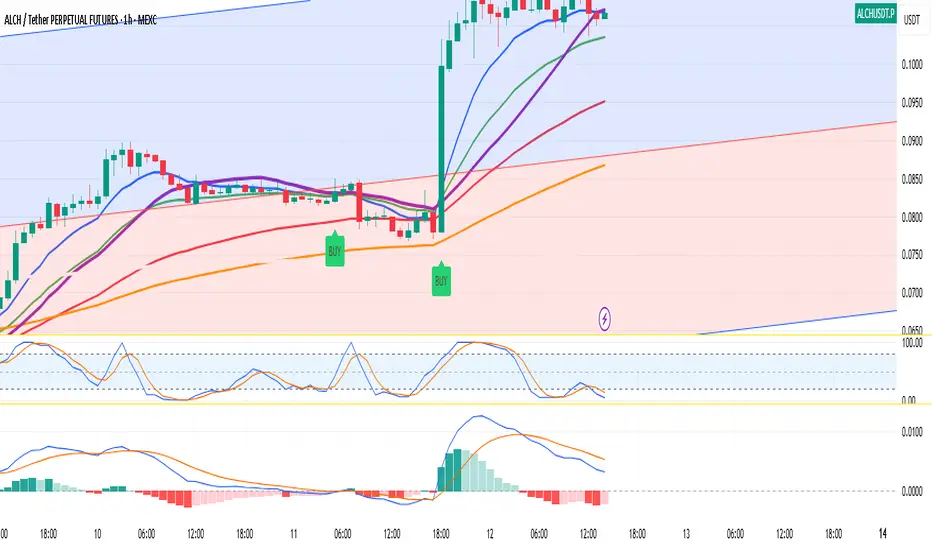
This TradingView Pine Script code is built for day traders, especially those trading crypto on a 1‑hour chart. In simple words, the script does the following:
Calculates Moving Averages:
It computes four exponential moving averages (EMAs) and two simple moving averages (SMAs) based on the closing price (or any price you select). Each moving average uses a different time period that you can adjust.
Plots Them on Your Chart:
The EMAs and SMAs are drawn on your chart in different colors and line thicknesses. This helps you quickly see the short-term and long-term trends.
Generates Buy and Sell Signals:
Buy Signal: When the fastest EMA (for example, a 10-period EMA) crosses above a slightly slower EMA (like a 21-period EMA) and the four EMAs are in a bullish order (meaning the fastest is above the next ones), the script will show a "BUY" label on the chart.
Sell Signal: When the fastest EMA crosses below the second fastest EMA and the four EMAs are lined up in a bearish order (the fastest is below the others), it displays a "SELL" label.
In essence, the code is designed to help you spot potential entry and exit points based on the relationships between multiple moving averages, which work as trend indicators. This makes it easier to decide when to trade on your 1‑hour crypto chart.
릴리즈 노트
update v2오픈 소스 스크립트
트레이딩뷰의 진정한 정신에 따라, 이 스크립트의 작성자는 이를 오픈소스로 공개하여 트레이더들이 기능을 검토하고 검증할 수 있도록 했습니다. 작성자에게 찬사를 보냅니다! 이 코드는 무료로 사용할 수 있지만, 코드를 재게시하는 경우 하우스 룰이 적용된다는 점을 기억하세요.
면책사항
해당 정보와 게시물은 금융, 투자, 트레이딩 또는 기타 유형의 조언이나 권장 사항으로 간주되지 않으며, 트레이딩뷰에서 제공하거나 보증하는 것이 아닙니다. 자세한 내용은 이용 약관을 참조하세요.
오픈 소스 스크립트
트레이딩뷰의 진정한 정신에 따라, 이 스크립트의 작성자는 이를 오픈소스로 공개하여 트레이더들이 기능을 검토하고 검증할 수 있도록 했습니다. 작성자에게 찬사를 보냅니다! 이 코드는 무료로 사용할 수 있지만, 코드를 재게시하는 경우 하우스 룰이 적용된다는 점을 기억하세요.
면책사항
해당 정보와 게시물은 금융, 투자, 트레이딩 또는 기타 유형의 조언이나 권장 사항으로 간주되지 않으며, 트레이딩뷰에서 제공하거나 보증하는 것이 아닙니다. 자세한 내용은 이용 약관을 참조하세요.