OPEN-SOURCE SCRIPT
업데이트됨 William %R MTF [DM]
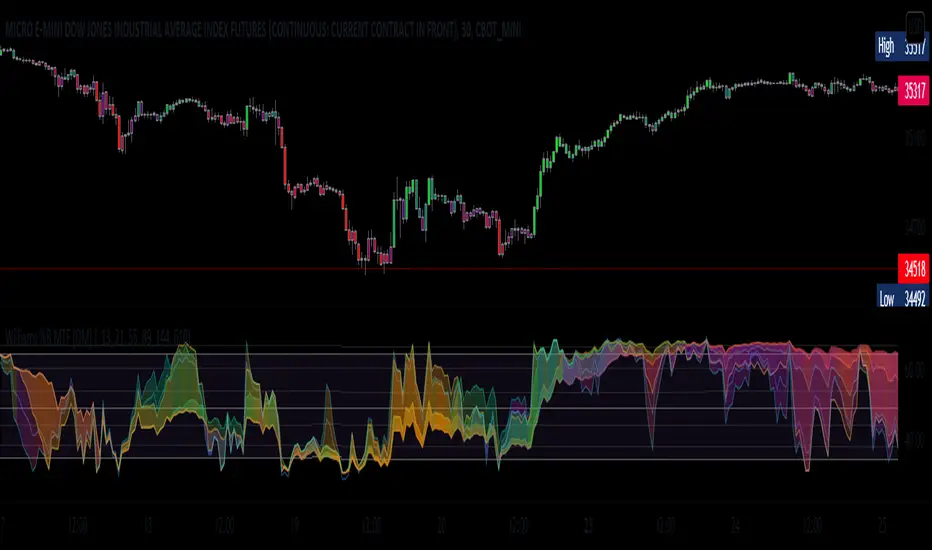
Greeting Colleagues
Today I share The Wlliams %R
Extras=
- 5 diferent length
- 1 extra signal with the technique used in the ultimate oscillator
- Fibo Leves based on ob os leves "width it's automatic"
- Colored bars bassed en average strength
- The indicator that is modified now has the same range as the ultimate oscillator.
Enjoy [;-)
//The Williams %R (%R) indicator was created by famed commodities trader and author Larry Williams.
//
//Calculation
//%R = (CurrentClose - Highest High) / (Highest High - Lowest Low) x -100
//
//Highest High = Highest High for the user defined look-back period.
//Lowest Low = Lowest Low for the user defined look-back period.
//
//The basics
//As previously mentioned, the %R is used to measure momentum. %R oscillates
//within a fixed range between the values of 0 and -100. Williams himself set the
//parameters of overbought as any reading between 0 and -20. His oversold
//parameters were readings between -80 and -100. It is important to note that these
//values are traditional examples. It may be beneficial for the technical analyst
//to set different parameters based on the specific instrument being analyzed. Wider
//or narrower overbought and oversold levels may be appropriate based on historical analysis.
//
//What to look for
//There are two major conditions identified by using the %R indicator.
//The first is standard overbought and oversold conditions. The second is momentum
//changes characterized by momentum failures.
//
//Overbought/Oversold
//Overbought and Oversold conditions are a very common signal generated by momentum oscillators.
//The %R indicator is no different.
릴리즈 노트
Minor changes릴리즈 노트
Added butterfly color rules to plotsAdded switch to hide parcels
릴리즈 노트
Minor changes릴리즈 노트
Added black background for use in the white charts오픈 소스 스크립트
트레이딩뷰의 진정한 정신에 따라, 이 스크립트의 작성자는 이를 오픈소스로 공개하여 트레이더들이 기능을 검토하고 검증할 수 있도록 했습니다. 작성자에게 찬사를 보냅니다! 이 코드는 무료로 사용할 수 있지만, 코드를 재게시하는 경우 하우스 룰이 적용된다는 점을 기억하세요.
면책사항
해당 정보와 게시물은 금융, 투자, 트레이딩 또는 기타 유형의 조언이나 권장 사항으로 간주되지 않으며, 트레이딩뷰에서 제공하거나 보증하는 것이 아닙니다. 자세한 내용은 이용 약관을 참조하세요.
오픈 소스 스크립트
트레이딩뷰의 진정한 정신에 따라, 이 스크립트의 작성자는 이를 오픈소스로 공개하여 트레이더들이 기능을 검토하고 검증할 수 있도록 했습니다. 작성자에게 찬사를 보냅니다! 이 코드는 무료로 사용할 수 있지만, 코드를 재게시하는 경우 하우스 룰이 적용된다는 점을 기억하세요.
면책사항
해당 정보와 게시물은 금융, 투자, 트레이딩 또는 기타 유형의 조언이나 권장 사항으로 간주되지 않으며, 트레이딩뷰에서 제공하거나 보증하는 것이 아닙니다. 자세한 내용은 이용 약관을 참조하세요.