OPEN-SOURCE SCRIPT
Normalized WMA Oscillator | Oquant
Normalized WMA Oscillator | Oquant
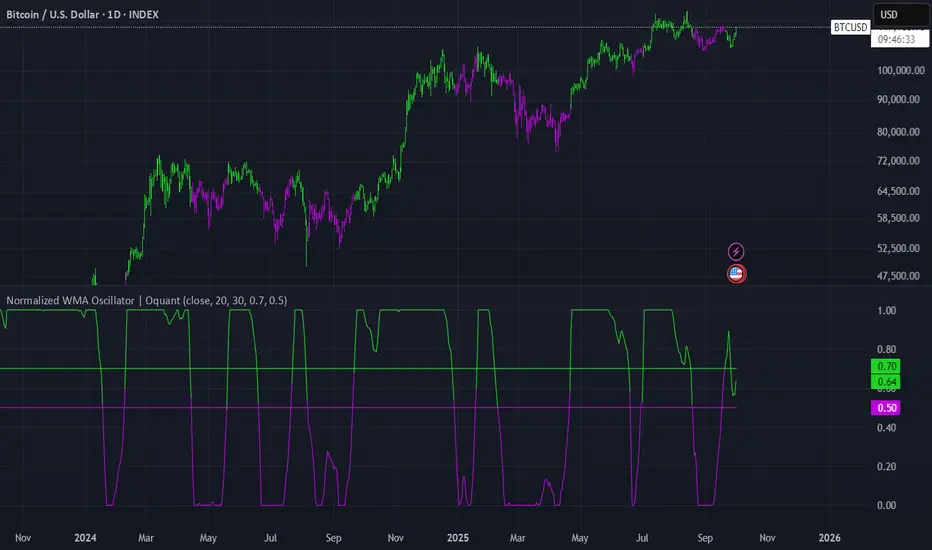
The Normalized WMA Oscillator is a trend-momentum indicator designed to help traders visualize the relative position of a Weighted Moving Average (WMA) within its recent price range.
What is a WMA and How It Works:
A Weighted Moving Average (WMA) is a type of moving average that gives more weight to recent price data, making it more responsive to price changes compared to a simple moving average. Each price point in the lookback period is multiplied by a weighting factor, with the most recent prices having the highest weights. The WMA helps traders identify potential trends more quickly.
This indicator applies min-max normalization to the standard WMA, scaling its values between 0 and 1 over a configurable lookback period. This allows traders to see whether the WMA is near its recent highs, lows, or midpoint, regardless of the absolute price level.
Key Features:
WMA Source Input: Choose price source for wma calculation.
Customizable WMA Length: Adjust the sensitivity of the WMA.
Min-Max Normalization Length: Smooth the scaling of WMA values between 0 and 1.
Signal Thresholds: Configurable upper and lower thresholds to indicate potential entries.
Visual Alerts: Color-coded oscillator and candles plot for bullish (green) and bearish (purple) signals.
Alerts Ready: Built-in alert conditions for crossovers and crossunders of the oscillator.
How It Works:
Calculate the WMA on the selected source.
Normalize its value using the minimum and maximum WMA values over the specified lookback period.
Generate long signals when the normalized WMA moves above the upper threshold, and short signals when it moves below the lower threshold.
Plot the oscillator and candles in green for bullish signals and purple for bearish signals.
Inputs:
Source: Data used for WMA calculation.
WMA Length: Period for Weighted Moving Average.
Min-Max Length: Lookback period for min-max scaling.
Upper Threshold: Level above which a long signal is considered.
Lower Threshold: Level below which a short signal is considered.
⚠️ Disclaimer: This indicator is intended for educational and informational purposes only. Trading/investing involves risk, and past performance does not guarantee future results. Always test and evaluate indicators/strategies before applying them in live markets. Use at your own risk.
오픈 소스 스크립트
트레이딩뷰의 진정한 정신에 따라, 이 스크립트의 작성자는 이를 오픈소스로 공개하여 트레이더들이 기능을 검토하고 검증할 수 있도록 했습니다. 작성자에게 찬사를 보냅니다! 이 코드는 무료로 사용할 수 있지만, 코드를 재게시하는 경우 하우스 룰이 적용된다는 점을 기억하세요.
Get access to the trading dashboard we built with professional traders—and start trading like a pro.
alpha-scope.org/
alpha-scope.org/
면책사항
해당 정보와 게시물은 금융, 투자, 트레이딩 또는 기타 유형의 조언이나 권장 사항으로 간주되지 않으며, 트레이딩뷰에서 제공하거나 보증하는 것이 아닙니다. 자세한 내용은 이용 약관을 참조하세요.