PROTECTED SOURCE SCRIPT
Cost Basis of DCA Strategy (Enhanced)
“Cost Basis of DCA Strategy (Enhanced): An Analytical Tool for Smarter DCA Investing”
The indicator designed here serves as a comprehensive analytical tool for evaluating a Dollar-Cost Averaging (DCA) strategy. Instead of merely recording scattered buy transactions, it integrates all purchases into a clear framework that reveals the real cost basis, portfolio performance, and capital allocation. Its primary function is to transform the concept of DCA from a mechanical process into a measurable and strategic decision-making system.
At the foundation of its operation, the user provides essential inputs such as the initial capital, the price and size of each buy transaction, and an optional sell price for hypothetical exit scenarios. With these inputs, the indicator calculates how many units were acquired in total, how much money was spent, and what the average cost per unit—the cost basis—truly is. This cost basis acts as the anchor for evaluating whether the market price has moved in favor or against the investor’s average entry point.
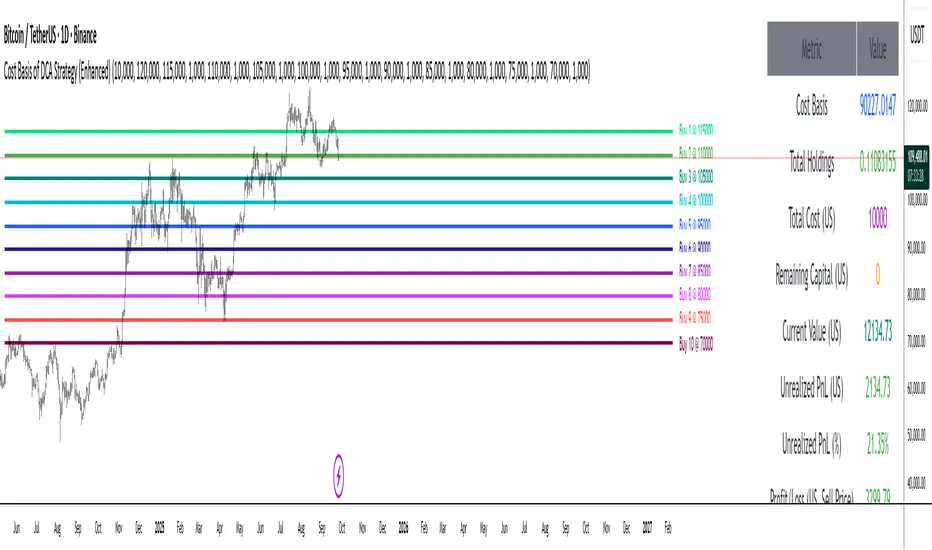
Beyond this, the indicator goes further by calculating both realized and unrealized dimensions of performance. It presents the current market value of holdings based on live price data and contrasts it with the total cost to derive unrealized profit or loss in both absolute terms and percentages. If the user sets a sell price, the tool simulates a full liquidation scenario, displaying the expected profit or loss should all holdings be sold at that level. This dual perspective enables the user to examine their strategy both from a present-value standpoint and a forward-looking one.
In addition, the indicator keeps track of remaining capital—the portion of initial funds not yet deployed into purchases—thus bridging the gap between portfolio construction and financial planning. It also reports the number of buy transactions, reinforcing awareness of execution discipline in DCA.
For visualization, the system is not confined to numbers alone. It marks each buy price directly on the price chart with distinct horizontal lines, labeled for clarity. This allows the trader to see not just statistics in a table but also the spatial relationship between historical entry points and ongoing market dynamics.
In essence, this indicator reframes the practice of DCA into a structured analytical exercise. It empowers investors to understand the true average entry cost, evaluate ongoing performance, and simulate future outcomes under different price scenarios. By doing so, it elevates DCA from a passive habit into an active, data-driven investment methodology, allowing users to make more informed, confident, and strategically grounded decisions.
The indicator designed here serves as a comprehensive analytical tool for evaluating a Dollar-Cost Averaging (DCA) strategy. Instead of merely recording scattered buy transactions, it integrates all purchases into a clear framework that reveals the real cost basis, portfolio performance, and capital allocation. Its primary function is to transform the concept of DCA from a mechanical process into a measurable and strategic decision-making system.
At the foundation of its operation, the user provides essential inputs such as the initial capital, the price and size of each buy transaction, and an optional sell price for hypothetical exit scenarios. With these inputs, the indicator calculates how many units were acquired in total, how much money was spent, and what the average cost per unit—the cost basis—truly is. This cost basis acts as the anchor for evaluating whether the market price has moved in favor or against the investor’s average entry point.
Beyond this, the indicator goes further by calculating both realized and unrealized dimensions of performance. It presents the current market value of holdings based on live price data and contrasts it with the total cost to derive unrealized profit or loss in both absolute terms and percentages. If the user sets a sell price, the tool simulates a full liquidation scenario, displaying the expected profit or loss should all holdings be sold at that level. This dual perspective enables the user to examine their strategy both from a present-value standpoint and a forward-looking one.
In addition, the indicator keeps track of remaining capital—the portion of initial funds not yet deployed into purchases—thus bridging the gap between portfolio construction and financial planning. It also reports the number of buy transactions, reinforcing awareness of execution discipline in DCA.
For visualization, the system is not confined to numbers alone. It marks each buy price directly on the price chart with distinct horizontal lines, labeled for clarity. This allows the trader to see not just statistics in a table but also the spatial relationship between historical entry points and ongoing market dynamics.
In essence, this indicator reframes the practice of DCA into a structured analytical exercise. It empowers investors to understand the true average entry cost, evaluate ongoing performance, and simulate future outcomes under different price scenarios. By doing so, it elevates DCA from a passive habit into an active, data-driven investment methodology, allowing users to make more informed, confident, and strategically grounded decisions.
보호된 스크립트입니다
이 스크립트는 비공개 소스로 게시됩니다. 하지만 이를 자유롭게 제한 없이 사용할 수 있습니다 – 자세한 내용은 여기에서 확인하세요.
면책사항
해당 정보와 게시물은 금융, 투자, 트레이딩 또는 기타 유형의 조언이나 권장 사항으로 간주되지 않으며, 트레이딩뷰에서 제공하거나 보증하는 것이 아닙니다. 자세한 내용은 이용 약관을 참조하세요.
면책사항
해당 정보와 게시물은 금융, 투자, 트레이딩 또는 기타 유형의 조언이나 권장 사항으로 간주되지 않으며, 트레이딩뷰에서 제공하거나 보증하는 것이 아닙니다. 자세한 내용은 이용 약관을 참조하세요.