INVITE-ONLY SCRIPT
업데이트됨 Radonezh Kir-Mary Beauty edition
Overview
Dedicated to rev. Kirill and Mary of Radonezh.
This indicator uniquely combines Cumulative Volume Delta (CVD) and price momentum with dynamic normalization to identify trend strength, reversals, supported by a combination of more traditional signal logic. Unlike traditional momentum oscillators, it integrates volume dynamics and advanced directional index to filter false signals and adapts to market volatility through automated scaling, offering a holistic view of price-action reliability.
Core Innovations
Key Features
Unique Value
By fusing volume delta dynamics with momentum filtering, this script addresses a critical gap in traditional indicators that treat price and volume in isolation. The closed-source logic focuses on institutional accumulation/distribution patterns, providing actionable signals without repainting.
Compatible with all assets and timeframes. No promotional content or external links included.
============================================
Trading strategy
============================================
Position Signals via DEMA Momentum Line Coloration
The main indicator line (orange/black) determines entry/exits based on its color intensity, which reflects trend strength and confirmation from filtered signals. Here's how it works:
Long Positions (Green/Teal)
Weak Long:
Dark Green = Price momentum rising without volume/Machine Learning (ML) confirmation.
Example: main line turns green but lacks volume spikes or ML buy signals.
Strong Long:
Bright Green = Momentum confirmed by:
Volume Surge: Volume exceeds 1.5x 20-period average.
ML Confirmation: ML score > 0.7 with price above EMA20.
Post-Drop Recovery: Price rebounds after a >1% drop on high volume. (not active as of now, will add a bit later, still working on it)
Short Positions (Red/Orange)
Weak Short:
Orange = Momentum declines without bearish confirmation.
Strong Short:
Bright Red = Confirmed by:
Volume Divergence: Rising price with falling CVD momentum.
ML Bearish: ML score > 0.7 + price below EMA20.
Overextension: RSI > 70 + price above upper Bollinger Band.
Neutral (Gray)
Flat Momentum:
Gray = Momentum near zero (±0.05) + low volatility (ATR < 1% of price).
Action: Avoid trades until color intensifies or stay in a position with a trailing stoploss until it's clear where the market goes (use HTF signal colour table to know what to expect).
Key Features
Adaptive Confirmation:
Colors brighten when signals align across:
Dynamic Risk Zones:
Gray areas highlight low-confidence periods, while bright colors mark high-probability entries.
Usage: Enter longs when the line turns bright green and exits when it fades to dark green/gray. Reverse for shorts. Combine with the built-in Victor-Predictor signals for optimal accuracy
============================================
Plans to add soon:
============================================
Dynamic Normalization: Scales CVD and price momentum to a fixed range (default: -20 to +20) using volatility-adjusted multipliers, ensuring consistent interpretation across assets/timeframes.
Divergence Detection: Flags discrepancies between volume-driven momentum (CVD) and price trends, highlighting potential reversals.
Adding 2 nearest psychological support and resistance levels.
Dedicated to rev. Kirill and Mary of Radonezh.
This indicator uniquely combines Cumulative Volume Delta (CVD) and price momentum with dynamic normalization to identify trend strength, reversals, supported by a combination of more traditional signal logic. Unlike traditional momentum oscillators, it integrates volume dynamics and advanced directional index to filter false signals and adapts to market volatility through automated scaling, offering a holistic view of price-action reliability.
Core Innovations
- Adapive Signals: Uses a proprietary correlation algorithm to weight momentum values, reducing noise in choppy markets.
- Lower timeframe entry points: (currently 1 minute only) and HTF line statuses for timeframe synchronisation (currently only 15 minutes and 1 hour status) for super-precise entry points
- Automatic drawing of resistance and support lines based on the proprietary algorithm for detecting volume/price synchronization and desynchronization levels.
- "Victor-predictor": price chart pointing line that shows where the price supposedly goes based on the machine-learning simulation with pine script based on the main 3 traditional classical indicators. Works independently from the rest of the indicator. Developed by @Skorcez (same team).
- Automatic recognition of possible long and short stop order placement levels. I do not filter them so use only within the general context of the indicator.
Key Features
- Volume-Price Correlation: CVD reflects institutional order flow, while price momentum quantifies trend acceleration.
- Auto-Scaling: Adjusts output range based on recent volatility (ATR), preventing overbought/oversold false positives.
- Visual Alerts: Marks divergence zones with colored trendlines and labels (regular/hidden bullish/bearish).
Unique Value
By fusing volume delta dynamics with momentum filtering, this script addresses a critical gap in traditional indicators that treat price and volume in isolation. The closed-source logic focuses on institutional accumulation/distribution patterns, providing actionable signals without repainting.
Compatible with all assets and timeframes. No promotional content or external links included.
============================================
Trading strategy
============================================
Position Signals via DEMA Momentum Line Coloration
The main indicator line (orange/black) determines entry/exits based on its color intensity, which reflects trend strength and confirmation from filtered signals. Here's how it works:
Long Positions (Green/Teal)
Weak Long:
Dark Green = Price momentum rising without volume/Machine Learning (ML) confirmation.
Example: main line turns green but lacks volume spikes or ML buy signals.
Strong Long:
Bright Green = Momentum confirmed by:
Volume Surge: Volume exceeds 1.5x 20-period average.
ML Confirmation: ML score > 0.7 with price above EMA20.
Post-Drop Recovery: Price rebounds after a >1% drop on high volume. (not active as of now, will add a bit later, still working on it)
Short Positions (Red/Orange)
Weak Short:
Orange = Momentum declines without bearish confirmation.
Strong Short:
Bright Red = Confirmed by:
Volume Divergence: Rising price with falling CVD momentum.
ML Bearish: ML score > 0.7 + price below EMA20.
Overextension: RSI > 70 + price above upper Bollinger Band.
Neutral (Gray)
Flat Momentum:
Gray = Momentum near zero (±0.05) + low volatility (ATR < 1% of price).
Action: Avoid trades until color intensifies or stay in a position with a trailing stoploss until it's clear where the market goes (use HTF signal colour table to know what to expect).
Key Features
Adaptive Confirmation:
Colors brighten when signals align across:
- Volume acceleration
- RSI and a few other extremes (oversold/overbought)
- Machine Learning predictions
Dynamic Risk Zones:
Gray areas highlight low-confidence periods, while bright colors mark high-probability entries.
Usage: Enter longs when the line turns bright green and exits when it fades to dark green/gray. Reverse for shorts. Combine with the built-in Victor-Predictor signals for optimal accuracy
============================================
Plans to add soon:
============================================
Dynamic Normalization: Scales CVD and price momentum to a fixed range (default: -20 to +20) using volatility-adjusted multipliers, ensuring consistent interpretation across assets/timeframes.
Divergence Detection: Flags discrepancies between volume-driven momentum (CVD) and price trends, highlighting potential reversals.
Adding 2 nearest psychological support and resistance levels.
릴리즈 노트
- Lower timeframe zoom box added (at the cost of making the script run significantly slower).- On first indicator load it prompts the y-coordinates of the 3 subcharts (until automatic scaling is implemented)
- HTF trend colour stripe added for visual multi-timeframe synchronisation
- Added bollinger bands for best position opening search
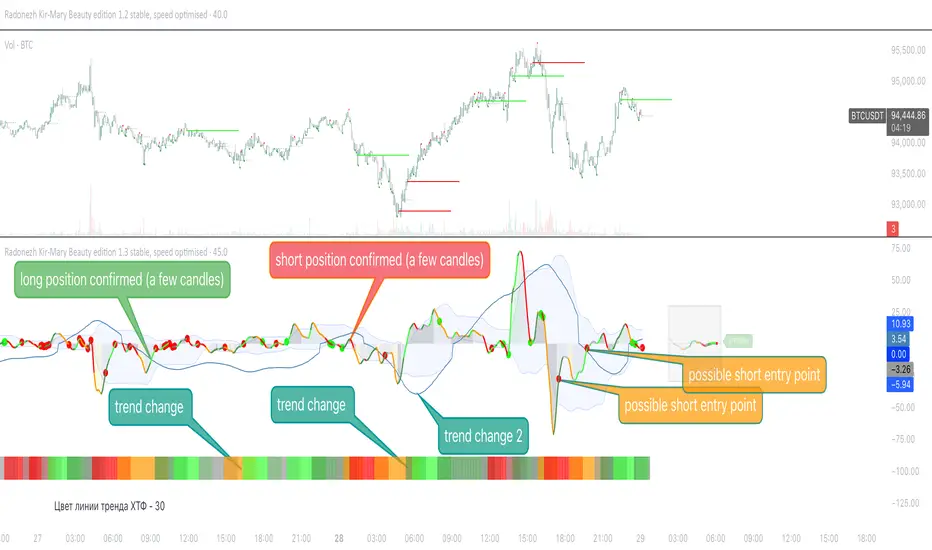
Simple trading strategy:
- bright green line on greenish HTF trend for longs (ideally with a green dot).
- bright red line on red specter for shorts (ideally accompanied by a red dot).
Keep until opposite color shows up.
릴리즈 노트
minor improvement for laptop 1-screen users - by default LTF window is aligned with the main chart axis. However you can move it around as convenient by modifying chart2_axis and LTF_offset in settings. 릴리즈 노트
minor temporary fix for "script takes too long to load" error on 5-min timeframe릴리즈 노트
updated version speed bug fixed, now loads in 5 seconds. LTF zoom is working fine
slightly reconfigured
릴리즈 노트
updated, now it has 2 trend detection methodsone is a blue line which is a modified idea from Depson. If he's okay with it being part of my script i'll keep it.
other one is HTF colour stripe in the bottom, but it fails on maybe 10% of the last price move where price/volume divergences occur.
릴리즈 노트
added a clear legend to a chart for understanding how it works릴리즈 노트
slight update - a box representing the candle range that is shown in LTF "zoom" area to the right of the chart for super-precise point of entry searchas per requested feature of multi-timeframe synchronisation
릴리즈 노트
- updated LTF dots algorythm- shows additional little arrows, where LTF line shows long and short reversals for sniping price reversals early
- added 3 optional filters in settings for LTF dots, based off Square macd line, bollinger bands direction, and HTF colour (experimental)
- removed the LTF microscope as a redundant feature
- fixed scaling issue
릴리즈 노트
tiny design update 릴리즈 노트
tiny design fix릴리즈 노트
another tiny update - now the LTF dots become bigger when near the resistance lines 릴리즈 노트
another tiny update with possible reversal points after creating a resistance line초대 전용 스크립트
이 스크립트는 작성자가 승인한 사용자만 접근할 수 있습니다. 사용하려면 요청 후 승인을 받아야 하며, 일반적으로 결제 후에 허가가 부여됩니다. 자세한 내용은 아래 작성자의 안내를 따르거나 cybermediaboy에게 직접 문의하세요.
트레이딩뷰는 스크립트의 작동 방식을 충분히 이해하고 작성자를 완전히 신뢰하지 않는 이상, 해당 스크립트에 비용을 지불하거나 사용하는 것을 권장하지 않습니다. 커뮤니티 스크립트에서 무료 오픈소스 대안을 찾아보실 수도 있습니다.
작성자 지시 사항
Free to use for the group of beta-testers for 1 month.
Best testers and contributors will have a lifelong access.
Telegram support group (Russian, Ukrainian, English, Greek, Spanish)
https://t.me/+cx0mBAlKytY1MGNk
Otherwise P.M. me through Tradingview.
면책사항
해당 정보와 게시물은 금융, 투자, 트레이딩 또는 기타 유형의 조언이나 권장 사항으로 간주되지 않으며, 트레이딩뷰에서 제공하거나 보증하는 것이 아닙니다. 자세한 내용은 이용 약관을 참조하세요.
초대 전용 스크립트
이 스크립트는 작성자가 승인한 사용자만 접근할 수 있습니다. 사용하려면 요청 후 승인을 받아야 하며, 일반적으로 결제 후에 허가가 부여됩니다. 자세한 내용은 아래 작성자의 안내를 따르거나 cybermediaboy에게 직접 문의하세요.
트레이딩뷰는 스크립트의 작동 방식을 충분히 이해하고 작성자를 완전히 신뢰하지 않는 이상, 해당 스크립트에 비용을 지불하거나 사용하는 것을 권장하지 않습니다. 커뮤니티 스크립트에서 무료 오픈소스 대안을 찾아보실 수도 있습니다.
작성자 지시 사항
Free to use for the group of beta-testers for 1 month.
Best testers and contributors will have a lifelong access.
Telegram support group (Russian, Ukrainian, English, Greek, Spanish)
https://t.me/+cx0mBAlKytY1MGNk
Otherwise P.M. me through Tradingview.
면책사항
해당 정보와 게시물은 금융, 투자, 트레이딩 또는 기타 유형의 조언이나 권장 사항으로 간주되지 않으며, 트레이딩뷰에서 제공하거나 보증하는 것이 아닙니다. 자세한 내용은 이용 약관을 참조하세요.