PROTECTED SOURCE SCRIPT
업데이트됨 LEG
Introduction
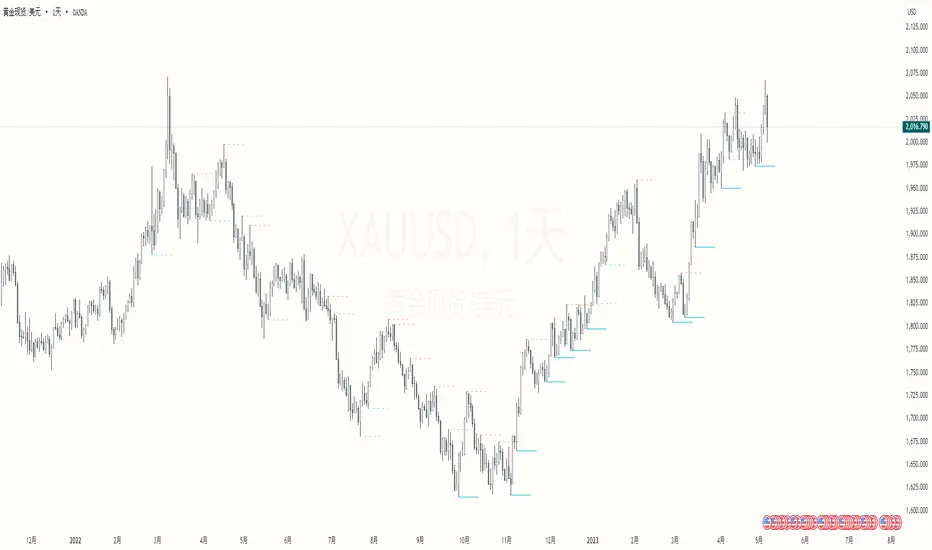
The LEG indicator is an advanced technical analysis tool designed for traders to identify key levels and trading opportunities in the market. By combining Fair Value Gap (FVG) and Swing Point (SP) analysis, the indicator draws important "leg" lines that represent critical areas of market structure change. The LEG indicator helps traders identify potential support and resistance levels, enabling them to make more informed entry and exit decisions.
Use Cases
Trend Identification: Determine market trend direction through multiple unmitigated LEG lines in the same direction
Support/Resistance Areas: LEG lines often become temporary support or resistance levels
Pullback Trading: Look for entry opportunities when price pulls back to unmitigated LEG lines
Stop Loss Placement: Use LEG lines as reference points for stop loss placement
Market Structure Analysis: Understand market structure changes through the creation and mitigation of LEG lines
Configuration Options
Enable LEG Drawing: Turn the LEG indicator on or off
Bullish/Bearish LEG Color: Customize colors for different direction LEG lines
LEG Line Width: Adjust the width of LEG lines (1-5)
LEG Line Style: Choose between solid, dashed, or dotted lines
LEG Line Length: Adjust the horizontal extension length of LEG lines (10-500)
Maximum LEG Display Count: Control the maximum number of LEG lines shown on the chart (1-100)
LEG Offset: Horizontally adjust the position of LEG lines, can offset left or right
Hide Mitigated LEGs: Choose whether to hide LEG lines after price crosses them
使用场景
趋势识别: 通过多个未缓解的同向LEG线判断市场趋势方向
支撑/阻力区域: LEG线通常成为市场的临时支撑或阻力位
回撤交易: 当价格回撤到未缓解的LEG线附近时寻找入场机会
止损设置: 使用LEG线作为止损位的参考点
市场结构分析: 通过LEG线的生成和缓解理解市场结构变化
릴리즈 노트
*Update on 25/4/7: Check whether the newly generated SP horizontal line segment meets the leg conditionsIntroduction
The LEG indicator is an advanced technical analysis tool designed for traders to identify key levels and trading opportunities in the market. By combining Fair Value Gap (FVG) and Swing Point (SP) analysis, the indicator draws important "leg" lines that represent critical areas of market structure change. The LEG indicator helps traders identify potential support and resistance levels, enabling them to make more informed entry and exit decisions.
Use Cases
Trend Identification: Determine market trend direction through multiple unmitigated LEG lines in the same direction
Support/Resistance Areas: LEG lines often become temporary support or resistance levels
Pullback Trading: Look for entry opportunities when price pulls back to unmitigated LEG lines
Stop Loss Placement: Use LEG lines as reference points for stop loss placement
Market Structure Analysis: Understand market structure changes through the creation and mitigation of LEG lines
Configuration Options
Enable LEG Drawing: Turn the LEG indicator on or off
Bullish/Bearish LEG Color: Customize colors for different direction LEG lines
LEG Line Width: Adjust the width of LEG lines (1-5)
LEG Line Style: Choose between solid, dashed, or dotted lines
LEG Line Length: Adjust the horizontal extension length of LEG lines (10-500)
Maximum LEG Display Count: Control the maximum number of LEG lines shown on the chart (1-100)
LEG Offset: Horizontally adjust the position of LEG lines, can offset left or right
Hide Mitigated LEGs: Choose whether to hide LEG lines after price crosses them
使用场景
趋势识别: 通过多个未缓解的同向LEG线判断市场趋势方向
支撑/阻力区域: LEG线通常成为市场的临时支撑或阻力位
回撤交易: 当价格回撤到未缓解的LEG线附近时寻找入场机会
止损设置: 使用LEG线作为止损位的参考点
市场结构分析: 通过LEG线的生成和缓解理解市场结构变化
릴리즈 노트
In order not to violate TradingView community regulations, the new version user interface is in English릴리즈 노트
Add mitigated leg attribute options릴리즈 노트
Update English control panel릴리즈 노트
Update Chart보호된 스크립트입니다
이 스크립트는 비공개 소스로 게시됩니다. 하지만 이를 자유롭게 제한 없이 사용할 수 있습니다 – 자세한 내용은 여기에서 확인하세요.
면책사항
해당 정보와 게시물은 금융, 투자, 트레이딩 또는 기타 유형의 조언이나 권장 사항으로 간주되지 않으며, 트레이딩뷰에서 제공하거나 보증하는 것이 아닙니다. 자세한 내용은 이용 약관을 참조하세요.
면책사항
해당 정보와 게시물은 금융, 투자, 트레이딩 또는 기타 유형의 조언이나 권장 사항으로 간주되지 않으며, 트레이딩뷰에서 제공하거나 보증하는 것이 아닙니다. 자세한 내용은 이용 약관을 참조하세요.