OPEN-SOURCE SCRIPT
업데이트됨 Key Levels by MoneyTribe21
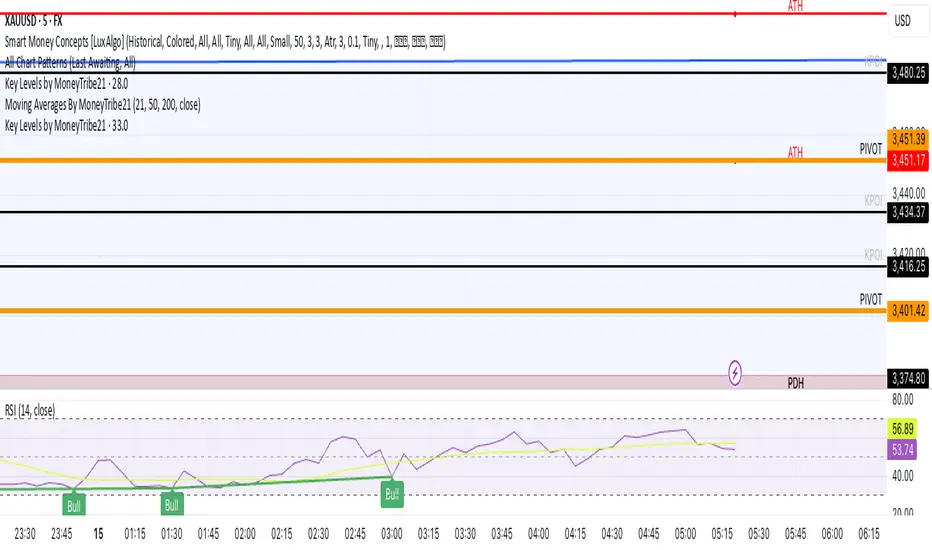
This custom script provides real-time tracking of key market price levels, helping traders identify critical support and resistance zones. It dynamically updates throughout the trading session, making it ideal for intraday trading, breakout strategies, and market structure analysis.
Features:
Real-Time Tracking of Key Price Levels:
ATH (All-Time High): Tracks the highest price ever reached for the asset.
PDH (Previous Day High): Marks the high of the last trading day,
PDL (Previous Day Low): Marks the low of the last trading day, serving as dynamic support.
Resistance Level: Based on the current day’s high, signaling potential price rejection points.
Support Level: Based on the current day’s low, indicating potential price bounces.
Daily Open Price: Tracks the exact market open price at the start of the trading session.
Works Across All Timeframes:
Designed for intraday, swing, and long-term trading.
Automatically adjusts levels for Forex, Stocks, Crypto, and Indices.
Fully Customizable Settings:
Modify line colors, thickness, and styles for better chart readability.
Enable/disable specific levels based on trading preference.
Works on all TradingView-compatible brokers and platforms.
How to Use This Indicator:
Breakout & Reversal Trading:
If price breaks above PDH, it may indicate bullish momentum.
If price breaks below PDL, it may signal a bearish continuation.
ATH levels can act as strong resistance zones—watch for breakouts or rejection.
Dynamic Support & Resistance:
Resistance Level (Current Day High): If price fails to break, it may signal a reversal.
Support Level (Current Day Low): If price bounces off, it may confirm a strong uptrend.
Daily Open for Trend Confirmation:
Above Daily Open: Market sentiment is bullish.
Below Daily Open: Market sentiment is bearish.
Customization Options:
Toggle individual price levels ON/OFF for a clutter-free chart.
Customize colors, line styles, and alerts for better visualization.
Set alerts for breakouts & retests of key levels.
Ideal for Traders Who:
Want high-probability support & resistance zones in real-time.
Trade breakouts, reversals, or trend continuations.
Use market structure analysis for informed decision-making.
Need automatic price tracking instead of drawing levels manually.
Compatible with all TradingView timeframes & assets (Forex, Stocks, Crypto, Indices).
Designed for both beginner and advanced traders.
Add this indicator to your chart and start tracking key levels instantly.
릴리즈 노트
Fixed the ATH tracking on lower time frames based on historical bars using the higher time frames as a reference 릴리즈 노트
Tracking the ATH of monthly time frame오픈 소스 스크립트
트레이딩뷰의 진정한 정신에 따라, 이 스크립트의 작성자는 이를 오픈소스로 공개하여 트레이더들이 기능을 검토하고 검증할 수 있도록 했습니다. 작성자에게 찬사를 보냅니다! 이 코드는 무료로 사용할 수 있지만, 코드를 재게시하는 경우 하우스 룰이 적용된다는 점을 기억하세요.
면책사항
해당 정보와 게시물은 금융, 투자, 트레이딩 또는 기타 유형의 조언이나 권장 사항으로 간주되지 않으며, 트레이딩뷰에서 제공하거나 보증하는 것이 아닙니다. 자세한 내용은 이용 약관을 참조하세요.
오픈 소스 스크립트
트레이딩뷰의 진정한 정신에 따라, 이 스크립트의 작성자는 이를 오픈소스로 공개하여 트레이더들이 기능을 검토하고 검증할 수 있도록 했습니다. 작성자에게 찬사를 보냅니다! 이 코드는 무료로 사용할 수 있지만, 코드를 재게시하는 경우 하우스 룰이 적용된다는 점을 기억하세요.
면책사항
해당 정보와 게시물은 금융, 투자, 트레이딩 또는 기타 유형의 조언이나 권장 사항으로 간주되지 않으며, 트레이딩뷰에서 제공하거나 보증하는 것이 아닙니다. 자세한 내용은 이용 약관을 참조하세요.