INVITE-ONLY SCRIPT
업데이트됨 Open Interest by strike
Overview:
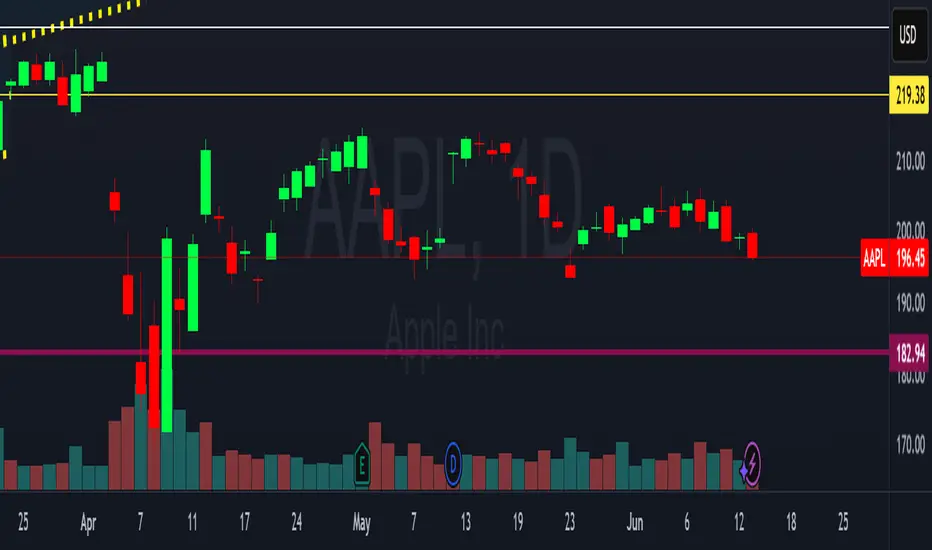
What is open interest (OI)? Is the total number of open derivative contracts, such as options, that have not been settled. These positions have been opened, but have not been closed out, expired, or exercised. This indicator helps with giving the open interest of selected equities on the market. It will give you the current weekly expiration date and has also the option to give the monthly expiration date (3rd Friday of the month).
How it works/Calculations:
This indicator will bring the data from an outside source and will have the closest options strikes to the current spot price of the underlying. The bars size will be equivalent to the amount of open interest. In the settings, you can see current weekly expiration options OI or have the option to see monthly expiration. When the weekly expiration is the monthly expiration week, then monthly expiration will show the next monthly expiration. (Example: On December 6, 2023 you will see weekly expiration of Dec 8, 2023 and monthly expiration will be Dec 15, 2023. On December 11, 2023 you will see weekly expiration of Dec 15, 2023 and monthly expiration will be Jan 19, 2024). You will also have the option to see the values or hide them. Also can see delta OI (for each strike subtract the calls and puts and display the remaining values). Open Interest updaters once a day, this indicator will update as well to give the most current values.
Current equities available for the data:
1. XLK 2. XLY 3. XLV 4. XLI 5. XLF 6. AAPL 7. MSFT 8. NVDA 9. AMD 10. V 11. Crm 12. Meta 13. Goog 14. NFLX 15. Amzn 16. Tsla 17. HD 18. Low 19. TGT 20. Wmt 21. XOM 22. Cvx 23. JPM 24. AXP 25. GS 26. ABBV 27. Cat 28. DE 29. BA 30. Fdx 31. UPS 32. Shop 33. SQ 34. Abnb 35. Snow 36. Coin 37. Crwd 38. Uber 39. SBUX 40. ENPH 41. XLP 42. XLE 43. XLB 44. NKE 45. UPS
How to use:
You should not be using this indicator for entries or stop. This indicator will help you see where there are possible levels that will serve as imaginary support and resistance.
Settings:
As above, you can choose weekly or monthly expiration date as explained above. Also you can choose to see the values or delta OI or no values.
Disclaimer:
This is still an indicator that in no way should be used alone.
The information contained in this script does not constitute financial advice or a solicitation to buy or sell any securities of any type. I will not accept liability for any loss or damage, including without limitation any loss of profit, which may arise directly or indirectly from the use of or reliance on such information.
All investments involve risk, and the past performance of a security, industry, sector, market, financial product, trading strategy, backtest, or individual's trading does not guarantee future results or returns. Investors are fully responsible for any investment decisions they make. Such decisions should be based solely on an evaluation of their financial circumstances, investment objectives, risk tolerance, and liquidity needs.
My Scripts are only for educational purposes!
릴리즈 노트
This update fixes a bug on the bars showing at times the wrong numbers. 릴리즈 노트
Update code to fix monthly and weekly data. 릴리즈 노트
Unfortunately script not working as intended. PLEASE DO NOT TRY TO GET ACCESS. IF WE CAN GET IT TO WORK WILL FIX IT.
초대 전용 스크립트
이 스크립트는 작성자가 승인한 사용자만 접근할 수 있습니다. 사용하려면 요청 후 승인을 받아야 하며, 일반적으로 결제 후에 허가가 부여됩니다. 자세한 내용은 아래 작성자의 안내를 따르거나 ScanYourStrat에게 직접 문의하세요.
트레이딩뷰는 스크립트의 작동 방식을 충분히 이해하고 작성자를 완전히 신뢰하지 않는 이상, 해당 스크립트에 비용을 지불하거나 사용하는 것을 권장하지 않습니다. 커뮤니티 스크립트에서 무료 오픈소스 대안을 찾아보실 수도 있습니다.
작성자 지시 사항
Not working at the moment.
면책사항
해당 정보와 게시물은 금융, 투자, 트레이딩 또는 기타 유형의 조언이나 권장 사항으로 간주되지 않으며, 트레이딩뷰에서 제공하거나 보증하는 것이 아닙니다. 자세한 내용은 이용 약관을 참조하세요.