OPEN-SOURCE SCRIPT
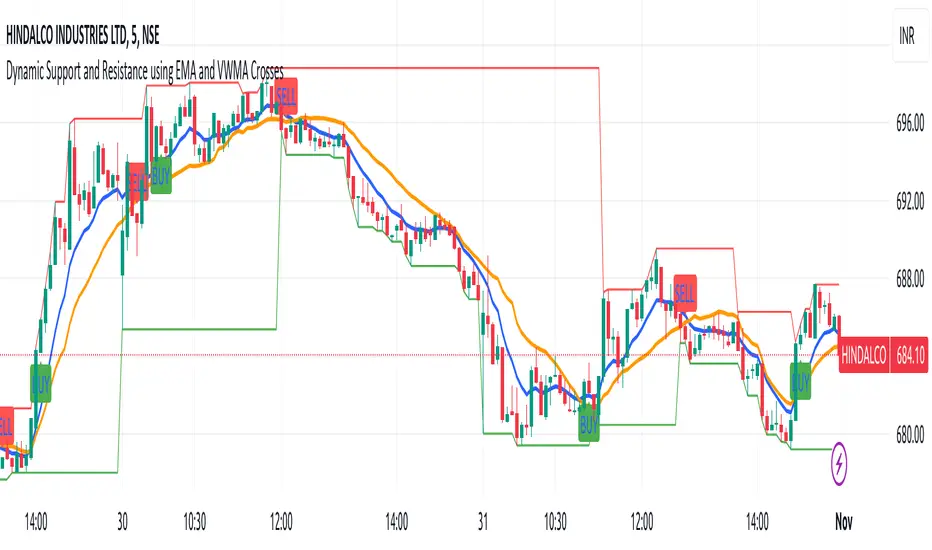
Intraday buy and sell indicator for stock and options

This powerful intraday trading indicator leverages two key crossovers for buy and sell signals, optimized for stocks and options trading:
EMA9 Crossover: The 9-period Exponential Moving Average (EMA9) responds quickly to price changes, making it ideal for capturing short-term momentum shifts. A bullish signal is generated when the stock price crosses above the EMA9, indicating a potential upward trend, while a bearish signal occurs when the price crosses below, signaling a potential reversal.
VWMA Crossover Confirmation: The Volume-Weighted Moving Average (VWMA) provides further confirmation of trend direction by integrating volume data. When the VWMA aligns with EMA9 (price crosses above both for buy or below for sell), the signals are validated, increasing the probability of a successful trade.
How It Works:
Buy Signal: Generated when the stock price crosses above EMA9 and VWMA in unison, indicating strong bullish momentum.
Sell Signal: Generated when the stock price crosses below EMA9 and VWMA, signaling potential bearish momentum.
This indicator is designed to provide high-quality entry and exit points for intraday trades, filtering out weaker signals and reducing whipsaws. It’s ideal for active traders seeking a strategic edge by combining price action with volume confirmation for higher probability trades.
오픈 소스 스크립트
트레이딩뷰의 진정한 정신에 따라, 이 스크립트의 작성자는 이를 오픈소스로 공개하여 트레이더들이 기능을 검토하고 검증할 수 있도록 했습니다. 작성자에게 찬사를 보냅니다! 이 코드는 무료로 사용할 수 있지만, 코드를 재게시하는 경우 하우스 룰이 적용된다는 점을 기억하세요.
면책사항
해당 정보와 게시물은 금융, 투자, 트레이딩 또는 기타 유형의 조언이나 권장 사항으로 간주되지 않으며, 트레이딩뷰에서 제공하거나 보증하는 것이 아닙니다. 자세한 내용은 이용 약관을 참조하세요.
오픈 소스 스크립트
트레이딩뷰의 진정한 정신에 따라, 이 스크립트의 작성자는 이를 오픈소스로 공개하여 트레이더들이 기능을 검토하고 검증할 수 있도록 했습니다. 작성자에게 찬사를 보냅니다! 이 코드는 무료로 사용할 수 있지만, 코드를 재게시하는 경우 하우스 룰이 적용된다는 점을 기억하세요.
면책사항
해당 정보와 게시물은 금융, 투자, 트레이딩 또는 기타 유형의 조언이나 권장 사항으로 간주되지 않으며, 트레이딩뷰에서 제공하거나 보증하는 것이 아닙니다. 자세한 내용은 이용 약관을 참조하세요.