PROTECTED SOURCE SCRIPT
업데이트됨 Market Breadth - Secondary Indicator
Market Breath is the equilibrium between number of stocks in advance to those in a decline, in other words a method to determine the current market environment. In a positive phase bullish setups will have improved probabilities and presence, whereas in a bearish phase the opposite would be true.
The primary indicator is the main tool used to identify whether the market is favorable for bullish- or bearish setups. The secondary indicator is complementary, with the purpose to calculate the intensity of each phase. In other words, overbought or oversold conditons.
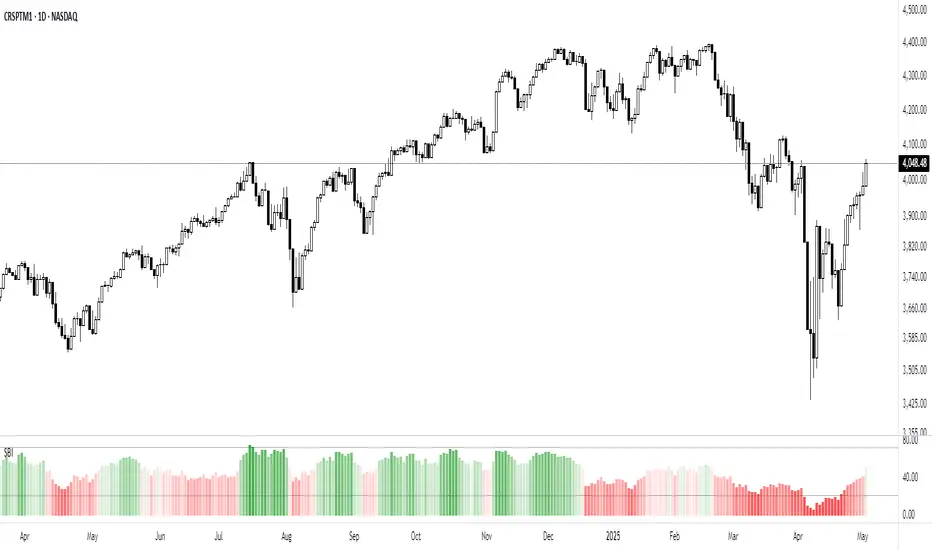
The calculations are made based on the MMFI (% of stocks above 50 DMA).
- Red Column: Value below 21 would be considered oversold, where 10 < would be extreme / capitulation.
- Green Column: Value above 72 would be considered overbought, however in a stable bullish phase would on the contrary indicate positive acceleration.
There are also prints of dots that are created around / end of these extremes, which can indicate a reversal attempt. This will be printed when there is a countertrend move in the MMFI, VIX and SPY from an extreme value.
- Red Dots: Countertrend (down expansion) from a bullish phase.
- Green Dots: Countertrend (up expansion) from a bearish phase.
- Black Dots: Countertrend (up expansion) from an extreme / deep bearish phase.
How To Use
Use the primary indicator to note whether the market is more favorable for bullish- or bearish setups. Then look at the secondary breadth indicator and note whether there are extreme numbers and take that into account with a discretionary perspective. Example In case the market is in a bearish phase, have extended to the downside for several weeks and the primary breadth indicator is bearish. But he secondary show oversold levels with reversal prints, one should consider to be more careful on short side to risk of mean reversion. In simple terms these can be used to determine whether the current market is appropriate for selected setups.
The primary indicator is the main tool used to identify whether the market is favorable for bullish- or bearish setups. The secondary indicator is complementary, with the purpose to calculate the intensity of each phase. In other words, overbought or oversold conditons.
The calculations are made based on the MMFI (% of stocks above 50 DMA).
- Red Column: Value below 21 would be considered oversold, where 10 < would be extreme / capitulation.
- Green Column: Value above 72 would be considered overbought, however in a stable bullish phase would on the contrary indicate positive acceleration.
There are also prints of dots that are created around / end of these extremes, which can indicate a reversal attempt. This will be printed when there is a countertrend move in the MMFI, VIX and SPY from an extreme value.
- Red Dots: Countertrend (down expansion) from a bullish phase.
- Green Dots: Countertrend (up expansion) from a bearish phase.
- Black Dots: Countertrend (up expansion) from an extreme / deep bearish phase.
How To Use
Use the primary indicator to note whether the market is more favorable for bullish- or bearish setups. Then look at the secondary breadth indicator and note whether there are extreme numbers and take that into account with a discretionary perspective. Example In case the market is in a bearish phase, have extended to the downside for several weeks and the primary breadth indicator is bearish. But he secondary show oversold levels with reversal prints, one should consider to be more careful on short side to risk of mean reversion. In simple terms these can be used to determine whether the current market is appropriate for selected setups.
릴리즈 노트
Gradient color on MMFI릴리즈 노트
Absolute value for SPY price expansion.릴리즈 노트
Counter indicator (dots) are still experimental, now use a different code (derived from SPY, MMFI, MMFD and VIX).릴리즈 노트
Added indication for breadth thrusts, which is the ratio between stocks in advance and decline. Condition would be met when either one outnumber with => 2 ratio over 10 days. This can indicate market turns and acceleration. Is printed in shape of arrows in the indicator panel.릴리즈 노트
Default Labels릴리즈 노트
This version is based exclusively on the MMFI, which measures the percentage of U.S. stocks trading above their 50-day moving average.The script has been simplified by removing redundant overlays and secondary inputs. Gradient coloration has been added, and visual thresholds are shown at the 72% and 21% levels.
보호된 스크립트입니다
이 스크립트는 비공개 소스로 게시됩니다. 하지만 이를 자유롭게 제한 없이 사용할 수 있습니다 – 자세한 내용은 여기에서 확인하세요.
Technical Trading: Research and Application
stockleave.com/
stockleave.com/
면책사항
해당 정보와 게시물은 금융, 투자, 트레이딩 또는 기타 유형의 조언이나 권장 사항으로 간주되지 않으며, 트레이딩뷰에서 제공하거나 보증하는 것이 아닙니다. 자세한 내용은 이용 약관을 참조하세요.
보호된 스크립트입니다
이 스크립트는 비공개 소스로 게시됩니다. 하지만 이를 자유롭게 제한 없이 사용할 수 있습니다 – 자세한 내용은 여기에서 확인하세요.
Technical Trading: Research and Application
stockleave.com/
stockleave.com/
면책사항
해당 정보와 게시물은 금융, 투자, 트레이딩 또는 기타 유형의 조언이나 권장 사항으로 간주되지 않으며, 트레이딩뷰에서 제공하거나 보증하는 것이 아닙니다. 자세한 내용은 이용 약관을 참조하세요.