PROTECTED SOURCE SCRIPT
업데이트됨 Breakout Sideway Range [5ema]

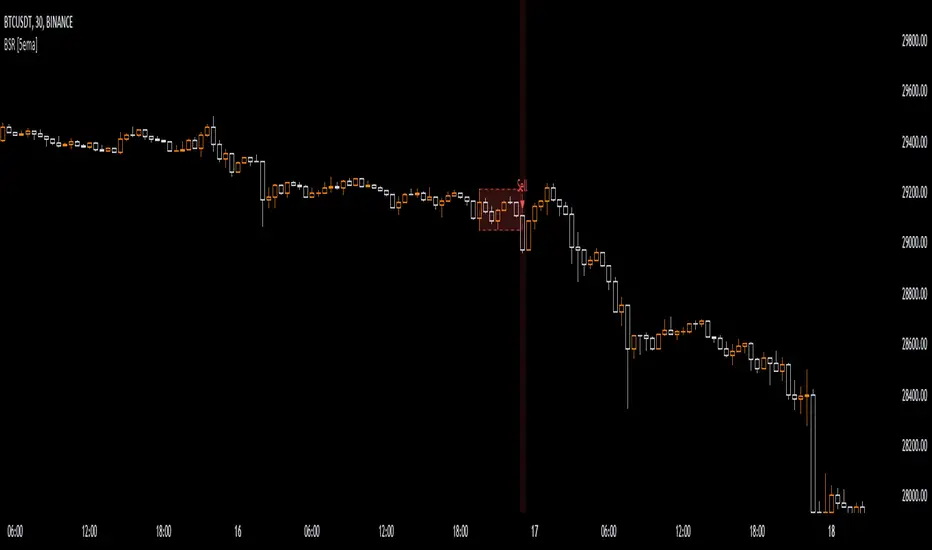
This indicator can find the breakout of sideway range. The range create by the bars inside the highest bar.
Compared to my previous script name Breaking Bar, this one is different in important point:
-----
How to calculate?
-----
How to set up?
-----
How to use?
-----
This indicator is for reference only, you need your own method and strategy.
If you have any questions, please let me know in the comments.
Compared to my previous script name Breaking Bar, this one is different in important point:
- The Highest bar can be found at higher timeframe.
- No have opening candles of each session.
-----
How to calculate?
- Find the bar have full body or full bar is highest on number left bars.
- The sideway range are bars inside highest bar.
- Find the bar breakout highest bar are reversal candle patterns.
- The highest bar can set up on higher timeframe.
-----
How to set up?
- Change the input value of left bar to find the highest bar.
- Change the input value of right bar to find the inside bar of highest.
- Select the time frame to find the highest bar. Set "chart" if want to follow chart.
- Select the way find highest bar, by price high and low or open and close.
-----
How to use?
- Choose the signal buy or sell or all.
- Change the color or range if want.
- Hidden, display, change color background of signal bar.
- Make the alert when signal appear.
- Refer the signal appear on chart:
- Signal Sell:
- Signal Buy:
-----
This indicator is for reference only, you need your own method and strategy.
If you have any questions, please let me know in the comments.
릴리즈 노트
Update:Change range and shape color, style.
보호된 스크립트입니다
이 스크립트는 비공개 소스로 게시됩니다. 하지만 이를 자유롭게 제한 없이 사용할 수 있습니다 – 자세한 내용은 여기에서 확인하세요.
면책사항
해당 정보와 게시물은 금융, 투자, 트레이딩 또는 기타 유형의 조언이나 권장 사항으로 간주되지 않으며, 트레이딩뷰에서 제공하거나 보증하는 것이 아닙니다. 자세한 내용은 이용 약관을 참조하세요.
보호된 스크립트입니다
이 스크립트는 비공개 소스로 게시됩니다. 하지만 이를 자유롭게 제한 없이 사용할 수 있습니다 – 자세한 내용은 여기에서 확인하세요.
면책사항
해당 정보와 게시물은 금융, 투자, 트레이딩 또는 기타 유형의 조언이나 권장 사항으로 간주되지 않으며, 트레이딩뷰에서 제공하거나 보증하는 것이 아닙니다. 자세한 내용은 이용 약관을 참조하세요.