OPEN-SOURCE SCRIPT
RSI + Support/Resistance Zones + EMA
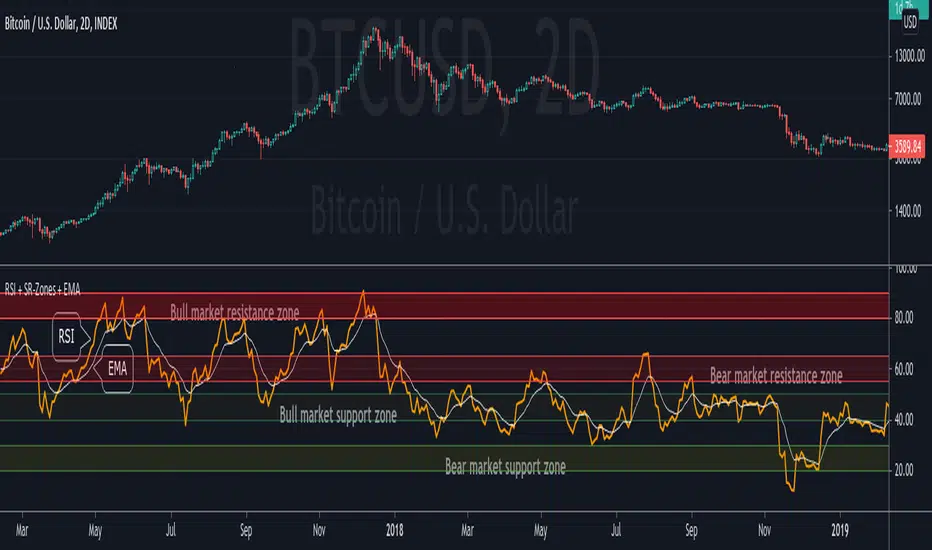
This indicator enhances the RSI with support and resistance zones and an EMA.
RSI: a regular RSI (default: orange / 14 period)
EMA: an EMA on the RSI (default: light gray / 10 period)
RSI support/resistance zones
SR-Zones for bull markets: In a bull market the price tends to find resistance between 80 and 90 and support between 40 and 50 RSI.
SR-Zones for bear markets: In a bear market the price tends to find resistance between 55 and 65 and support between 20 and 30 RSI.
The concept of these support and resistance zones has been popularized by Constance Brown in her book Technical Analysis for the Trading Professional. The SR zones are described in the first chapter which is available in the preview section on Amazon.
RSI-EMA
The EMA on the RSI can also be used as support and resistance. For example, you can be use it for a simple strategy such as the following: In an uptrend after a significant correction during which the RSI has been below the EMA for some time, wait for the RSI to cross above the EMA to go long and exit (partially) after the RSI crossed down the EMA.
Hint: All visual elements (RSI, EMA, support zones) can be enabled/disabled and adjusted individually.
오픈 소스 스크립트
트레이딩뷰의 진정한 정신에 따라, 이 스크립트의 작성자는 이를 오픈소스로 공개하여 트레이더들이 기능을 검토하고 검증할 수 있도록 했습니다. 작성자에게 찬사를 보냅니다! 이 코드는 무료로 사용할 수 있지만, 코드를 재게시하는 경우 하우스 룰이 적용된다는 점을 기억하세요.
면책사항
해당 정보와 게시물은 금융, 투자, 트레이딩 또는 기타 유형의 조언이나 권장 사항으로 간주되지 않으며, 트레이딩뷰에서 제공하거나 보증하는 것이 아닙니다. 자세한 내용은 이용 약관을 참조하세요.
오픈 소스 스크립트
트레이딩뷰의 진정한 정신에 따라, 이 스크립트의 작성자는 이를 오픈소스로 공개하여 트레이더들이 기능을 검토하고 검증할 수 있도록 했습니다. 작성자에게 찬사를 보냅니다! 이 코드는 무료로 사용할 수 있지만, 코드를 재게시하는 경우 하우스 룰이 적용된다는 점을 기억하세요.
면책사항
해당 정보와 게시물은 금융, 투자, 트레이딩 또는 기타 유형의 조언이나 권장 사항으로 간주되지 않으며, 트레이딩뷰에서 제공하거나 보증하는 것이 아닙니다. 자세한 내용은 이용 약관을 참조하세요.