OPEN-SOURCE SCRIPT
업데이트됨 [blackcat] L3 Breakout Indicator
OVERVIEW
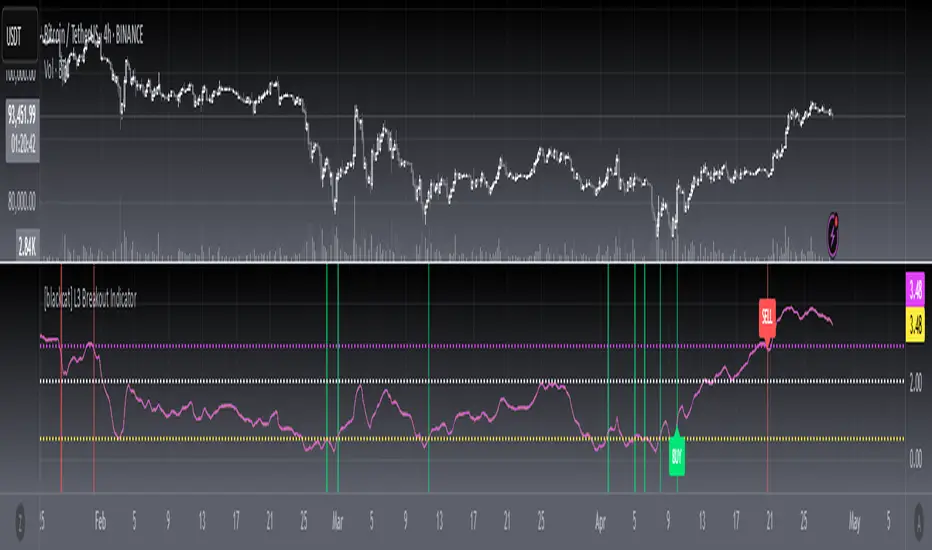
This script provides a breakout detection system ([blackcat] L3 Breakout Indicator) analyzing price momentum across timeframes. It identifies market entry/exit zones through dynamically scaled thresholds and visual feedback layers.
FEATURES
Dual momentum visualization: • Price Momentum Ratio Plot (yellow) • Filtered Signal Value Plot (fuchsia)
Adjustable trade boundaries: ▪ Lower Threshold (default: 0.5) ▪ Upper Threshold (default: 2.9) ▪ Central boundary (fixed at 2.0)
Real-time visual feedback: ☀ Buy zone highlights (lime) on momentum crossover ⚠ Sell zone highlights (red) on momentum cross-under ♦ Dynamic convergence area between plots (colored gradient)
HOW TO USE
Interpretation Flow
Monitor momentum plots relative to threshold lines
Actionable signals occur when momentum crosses thresholds
Persistent movement above/below central boundary indicates trend continuation
Key Zones
• Below 0.5: Potential buying opportunity zone
• Above 2.0: Cautionary selling region
• Between 0.5-2.0: Neutral consolidation phase
Optimization Tips
Adjust thresholds based on asset volatility
Combine with volume metrics for confirmation
Backtest parameters using historical data
LIMITATIONS
• Lag induced by 4-period EMA smoothing
• Historical dependency in calculating extremes (lowest(100)/highest(250))
• No built-in risk management protocols (stop loss take profit)
• Performance variability during sideways markets
릴리즈 노트
📈 [blackcat] L3 Breakout Indicator is an advanced TradingView indicator designed to identify potential breakout points in market momentum. This script utilizes custom calculations and visual elements to help traders spot key levels where significant price movements may occur.FEATURES
Custom function for retrieving first non-NaN values
User-adjustable thresholds for signal boundaries
Calculation of price momentum ratio
Dynamic plotting of momentum ratios and filtered signals
Visual representation of buy/sell zones
Clear labeling of buy/sell signals
Alerts for threshold crossings
HOW TO USE
Add the script to your TradingView chart.
Adjust input variables in the settings panel:
Lower Threshold
Upper Threshold
Observe the generated plots and signals on your chart:
Yellow line represents Price Momentum
Fuchsia line shows Filtered Signal
Dotted lines indicate threshold levels
Color-coded background for buy/sell zones
"BUY" and "SELL" labels appear at signal points
LIMITATIONS
Performance may vary across different markets and timeframes
False signals can occur in choppy or ranging markets
Requires proper understanding of momentum indicators
NOTES
The script calculates momentum based on recent lows and highs
Filters are applied to smooth out the momentum ratio
Labels are dynamically created and updated as signals occur
THANKS
Special thanks to the TradingView community for their valuable feedback and contributions to this indicator's development.
오픈 소스 스크립트
트레이딩뷰의 진정한 정신에 따라, 이 스크립트의 작성자는 이를 오픈소스로 공개하여 트레이더들이 기능을 검토하고 검증할 수 있도록 했습니다. 작성자에게 찬사를 보냅니다! 이 코드는 무료로 사용할 수 있지만, 코드를 재게시하는 경우 하우스 룰이 적용된다는 점을 기억하세요.
Avoid losing contact!Don't miss out! The first and most important thing to do is to join my Discord chat now! Click here to start your adventure: discord.com/invite/ZTGpQJq 防止失联,请立即行动,加入本猫聊天群: discord.com/invite/ZTGpQJq
면책사항
해당 정보와 게시물은 금융, 투자, 트레이딩 또는 기타 유형의 조언이나 권장 사항으로 간주되지 않으며, 트레이딩뷰에서 제공하거나 보증하는 것이 아닙니다. 자세한 내용은 이용 약관을 참조하세요.