OPEN-SOURCE SCRIPT
업데이트됨 Mean Reversion
The "Mean Reversion" indicator in this script is a popular trading strategy that is based on the concept that over time, prices tend to move back towards their mean or average. This trading strategy seeks to identify instances where the price has deviated significantly from its mean and therefore presents an opportunity to profit from its eventual reversion to the mean.
The script calculates the distance between the current price and the EMA using the ATR, which is a measure of volatility. By multiplying the ATR by a specified factor, the script establishes a distance between the current price and the EMA. If the price falls below this distance, it triggers a potential buy signal, indicating that the price may be oversold and due for a rebound.
The script also uses Bollinger Bands to help identify potential buying and selling opportunities. The Bollinger Bands are a technical indicator that measures the volatility of an asset by plotting two standard deviations away from a moving average. When the price moves outside of the Bollinger Bands, it can indicate that the asset is overbought or oversold, potentially triggering a buy or sell signal.
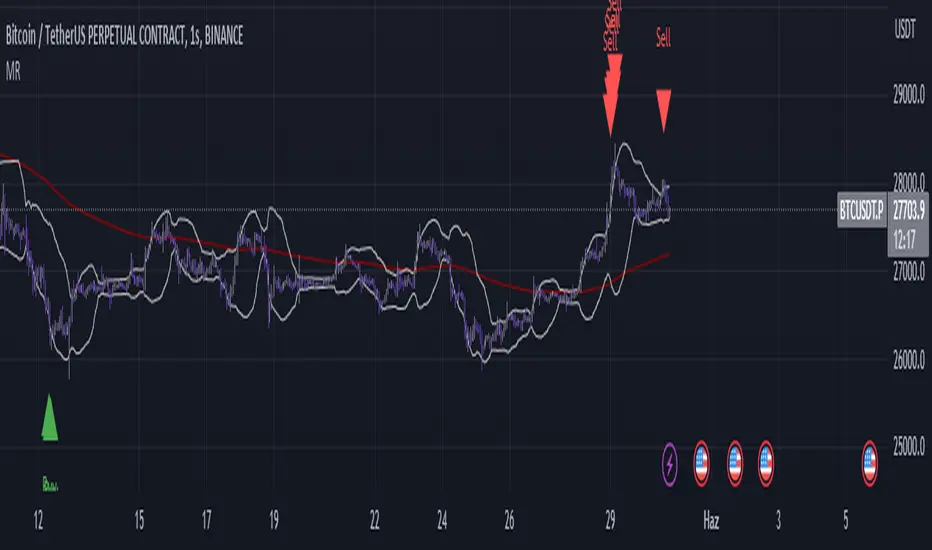
The script's "buySignal" variable is triggered when the price is below the EMA by the specified ATR distance and also falls below the lower Bollinger Band. Conversely, the "sellSignal" variable is triggered when the price is above the EMA by the specified ATR distance and also rises above the upper Bollinger Band.
The script plots the EMA, Bollinger Bands, and the buy and sell signals on the chart for easy visualization. Additionally, the script includes alerts that can be set up to notify the user when a buy or sell signal is triggered, so that they can act on the information in a timely manner.
In summary, this script is a Mean Reversion indicator that aims to identify potential opportunities to buy or sell assets based on deviations from their mean price using a combination of the ATR, EMA, and Bollinger Bands.
The script calculates the distance between the current price and the EMA using the ATR, which is a measure of volatility. By multiplying the ATR by a specified factor, the script establishes a distance between the current price and the EMA. If the price falls below this distance, it triggers a potential buy signal, indicating that the price may be oversold and due for a rebound.
The script also uses Bollinger Bands to help identify potential buying and selling opportunities. The Bollinger Bands are a technical indicator that measures the volatility of an asset by plotting two standard deviations away from a moving average. When the price moves outside of the Bollinger Bands, it can indicate that the asset is overbought or oversold, potentially triggering a buy or sell signal.
The script's "buySignal" variable is triggered when the price is below the EMA by the specified ATR distance and also falls below the lower Bollinger Band. Conversely, the "sellSignal" variable is triggered when the price is above the EMA by the specified ATR distance and also rises above the upper Bollinger Band.
The script plots the EMA, Bollinger Bands, and the buy and sell signals on the chart for easy visualization. Additionally, the script includes alerts that can be set up to notify the user when a buy or sell signal is triggered, so that they can act on the information in a timely manner.
In summary, this script is a Mean Reversion indicator that aims to identify potential opportunities to buy or sell assets based on deviations from their mean price using a combination of the ATR, EMA, and Bollinger Bands.
릴리즈 노트
I only changed the colors of the Bollinger Bands and EMA because they were too irritating to me.If you would like to buy me a coffe :)
Usdt TRC20: TAdJKsidFRHfSRsVRDaqwPkdMRrD98X15J
BTC BEP20: 0x02ea27f232495051eb5009fa0130234524303836
오픈 소스 스크립트
트레이딩뷰의 진정한 정신에 따라, 이 스크립트의 작성자는 이를 오픈소스로 공개하여 트레이더들이 기능을 검토하고 검증할 수 있도록 했습니다. 작성자에게 찬사를 보냅니다! 이 코드는 무료로 사용할 수 있지만, 코드를 재게시하는 경우 하우스 룰이 적용된다는 점을 기억하세요.
면책사항
해당 정보와 게시물은 금융, 투자, 트레이딩 또는 기타 유형의 조언이나 권장 사항으로 간주되지 않으며, 트레이딩뷰에서 제공하거나 보증하는 것이 아닙니다. 자세한 내용은 이용 약관을 참조하세요.
오픈 소스 스크립트
트레이딩뷰의 진정한 정신에 따라, 이 스크립트의 작성자는 이를 오픈소스로 공개하여 트레이더들이 기능을 검토하고 검증할 수 있도록 했습니다. 작성자에게 찬사를 보냅니다! 이 코드는 무료로 사용할 수 있지만, 코드를 재게시하는 경우 하우스 룰이 적용된다는 점을 기억하세요.
면책사항
해당 정보와 게시물은 금융, 투자, 트레이딩 또는 기타 유형의 조언이나 권장 사항으로 간주되지 않으며, 트레이딩뷰에서 제공하거나 보증하는 것이 아닙니다. 자세한 내용은 이용 약관을 참조하세요.