OPEN-SOURCE SCRIPT
업데이트됨 Original Bravo Swing
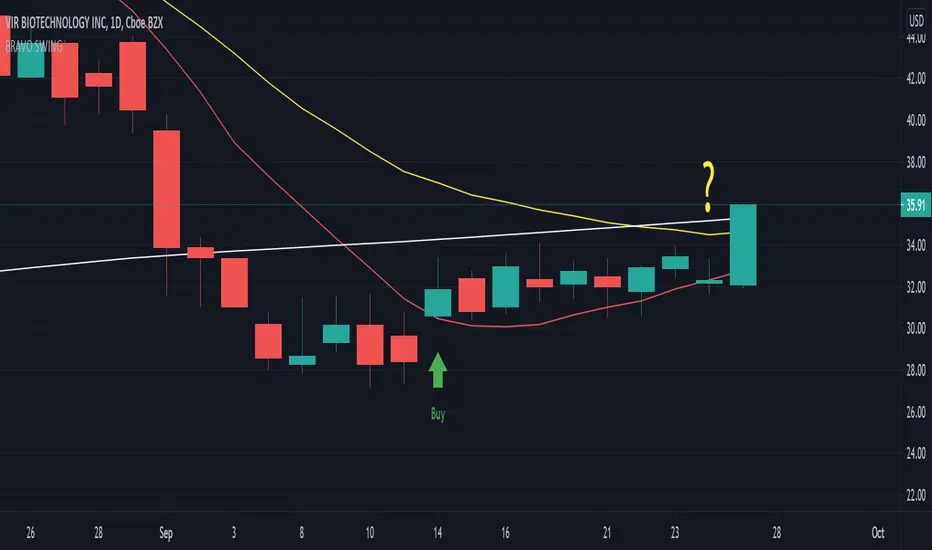
The Bravo Swing is based on the methods taught by YouTube celebrity J Bravo.
It uses the 9 day moving average as a base for selecting optimal entry and exit points.
Buy indicator:
A full candle closing above the 9 day moving average generally indicates a bullish signal for an entry.
If conditions are right, this can be seen as a great opportunity to buy.
Sell indicator:
If the candles continue to close above the 9 day moving average, the trend appears to remain bullish.
However, an exit is to be considered once a candle closes below the 9 day moving average, as this indicates a bearish signal may be approaching.
If you you're feeling confident about the uptrend continuing and choose to ignore the exit signal, a candle close below the 20 day exponential moving average should be used as a definite exit point.
Options:
Color code option to display the 180 day moving average in gray during downtrends and white during an uptrend.
The 50 day moving average can be turned on to help better visualize conflicting trends.
릴리즈 노트
The sell indicator now shows ONLY when a red candle closes below the SMA 9 - indicating a strong bearish momentum.A question mark is now displayed when a green candle closes below the SMA 9 - indicating a 'possible' bearish momentum and an early exit should be considered (this can be turned off in settings).
오픈 소스 스크립트
트레이딩뷰의 진정한 정신에 따라, 이 스크립트의 작성자는 이를 오픈소스로 공개하여 트레이더들이 기능을 검토하고 검증할 수 있도록 했습니다. 작성자에게 찬사를 보냅니다! 이 코드는 무료로 사용할 수 있지만, 코드를 재게시하는 경우 하우스 룰이 적용된다는 점을 기억하세요.
면책사항
해당 정보와 게시물은 금융, 투자, 트레이딩 또는 기타 유형의 조언이나 권장 사항으로 간주되지 않으며, 트레이딩뷰에서 제공하거나 보증하는 것이 아닙니다. 자세한 내용은 이용 약관을 참조하세요.
오픈 소스 스크립트
트레이딩뷰의 진정한 정신에 따라, 이 스크립트의 작성자는 이를 오픈소스로 공개하여 트레이더들이 기능을 검토하고 검증할 수 있도록 했습니다. 작성자에게 찬사를 보냅니다! 이 코드는 무료로 사용할 수 있지만, 코드를 재게시하는 경우 하우스 룰이 적용된다는 점을 기억하세요.
면책사항
해당 정보와 게시물은 금융, 투자, 트레이딩 또는 기타 유형의 조언이나 권장 사항으로 간주되지 않으며, 트레이딩뷰에서 제공하거나 보증하는 것이 아닙니다. 자세한 내용은 이용 약관을 참조하세요.