PROTECTED SOURCE SCRIPT
업데이트됨 Rolling Straddle with swing High/Low [Bluechip Algos]
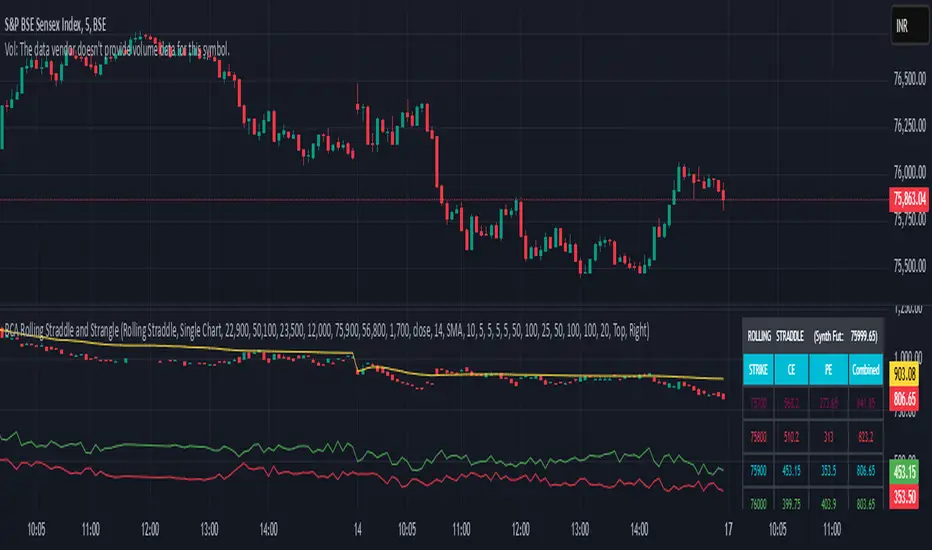
The Rolling Straddle and Strangle indicator is designed for options traders, particularly those trading in Indian indices such as NIFTY, BANKNIFTY, and others. This script not only allows users to analyze rolling straddle and strangle strategies by plotting various metrics but also has several indicators to apply on top of straddle/strangle charts. Especially indicators like swing high/low and ATR stop loss help you identify potential entry and exit points respectively.
About the Indicator
This indicator plots rolling straddles and strangles based on the selected symbol, strike prices, and expiry dates. Users can choose between analyzing single or multiple charts, and the script dynamically adjusts for different symbols, including NIFTY, BANKNIFTY, and other indices. Additionally, it incorporates several popular technical indicators to assist in decision-making.
Features
Dynamic Strike Price Calculation: Automatically adjusts strike prices based on the selected symbol and ATM (At-The-Money) reference.
Straddle and Strangle Analysis: Offers both rolling straddle and rolling strangle options, providing detailed views of option prices.
Table Plotting: Displays a table with the strike prices and corresponding CE (Call) and PE (Put) prices, including combined values.
Integrated Indicators: Includes customizable indicators such as Swing High/Low levels, ATR Stop Loss, Moving Averages, SuperTrend, and VWAP each designed to enhance strategy analysis.
Understanding the Indicator
1. Swing High/Low Levels
Purpose: This indicator identifies swing highs and lows in the price data, which are key levels that traders often use for placing stop-loss orders or for identifying potential reversal points.
Parameters:
Swing Length: The number of bars before and after the current bar that must be lower/higher to confirm a swing high/low.
How It Works: The indicator marks the highest high and lowest low over the specified period, helping traders to identify key support and resistance levels.
2. ATR Stop Loss
Purpose: The ATR Stop Loss is used to determine a dynamic stop-loss level based on the volatility of the asset. It adjusts the stop-loss level as the market conditions change.
Parameters:
ATR Period: The number of periods over which the ATR is calculated.
Multiplier: Factor used to adjust the stop-loss distance from the current price.
How It Works: The stop-loss level is adjusted dynamically based on the ATR value, providing protection against large, unexpected moves.
3. Moving Average (MA)
Purpose: The Moving Average is used to smooth out price data, providing a clearer view of the price trend over time. It is particularly useful for identifying the direction of the trend.
Parameters:
MA Source: The data series used for calculating the Moving Average (e.g., Close price).
MA Length: The number of periods over which the Moving Average is calculated.
MA Smoothing: The method used for smoothing the data, such as SMA (Simple Moving Average), EMA (Exponential Moving Average), WMA (Weighted Moving Average), or RMA (Running Moving Average).
4. SuperTrend
Purpose: The SuperTrend indicator is a trend-following indicator that helps traders identify the prevailing trend. It is based on the ATR (Average True Range) and provides clear buy/sell signals.
Parameters:
Factor: Multiplier applied to the ATR to calculate the upper and lower bands.
ATR Period: The period over which the ATR is calculated.
How It Works: When the price is above the SuperTrend line, it indicates a bullish trend, and when the price is below, it indicates a bearish trend.
5. VWAP (Volume Weighted Average Price)
Purpose: VWAP is a trading benchmark used by traders that gives the average price a security has traded at throughout the day, based on both volume and price. It is often used to determine the general direction of the market and as a basis for intraday trading strategies.
How It Works: VWAP calculates the cumulative price-volume divided by the cumulative volume over a specified period, providing a weighted average price that is more reflective of true market activity.
Input Parameters
Chart Type: Select between "Rolling Straddle" and "Rolling Strangle."
Symbol Selection: Choose from NIFTY, BANKNIFTY, MIDCAP, FINNIFTY, SENSEX, BANKEX, or a custom symbol.
Strike Interval: Customize strike intervals for different indices.
Expiry Date: Select the option expiry date.
Table Settings: Configure the table's position and colors for better visibility.
Indicator Settings: Customize each indicator’s parameters to suit your trading strategy, including lengths, smoothing methods, and colors.
릴리즈 노트
Added candlestick chartAdded Syth Fut as underlying
Fixed Vwap(A) issue for Sensex
릴리즈 노트
Fixed bugs in super trend and ATR stoploss보호된 스크립트입니다
이 스크립트는 비공개 소스로 게시됩니다. 하지만 이를 자유롭게 제한 없이 사용할 수 있습니다 – 자세한 내용은 여기에서 확인하세요.
면책사항
해당 정보와 게시물은 금융, 투자, 트레이딩 또는 기타 유형의 조언이나 권장 사항으로 간주되지 않으며, 트레이딩뷰에서 제공하거나 보증하는 것이 아닙니다. 자세한 내용은 이용 약관을 참조하세요.
보호된 스크립트입니다
이 스크립트는 비공개 소스로 게시됩니다. 하지만 이를 자유롭게 제한 없이 사용할 수 있습니다 – 자세한 내용은 여기에서 확인하세요.
면책사항
해당 정보와 게시물은 금융, 투자, 트레이딩 또는 기타 유형의 조언이나 권장 사항으로 간주되지 않으며, 트레이딩뷰에서 제공하거나 보증하는 것이 아닙니다. 자세한 내용은 이용 약관을 참조하세요.