PINE LIBRARY
업데이트됨 DrawIndicatorOnTheChart
Library "DrawIndicatorOnTheChart"
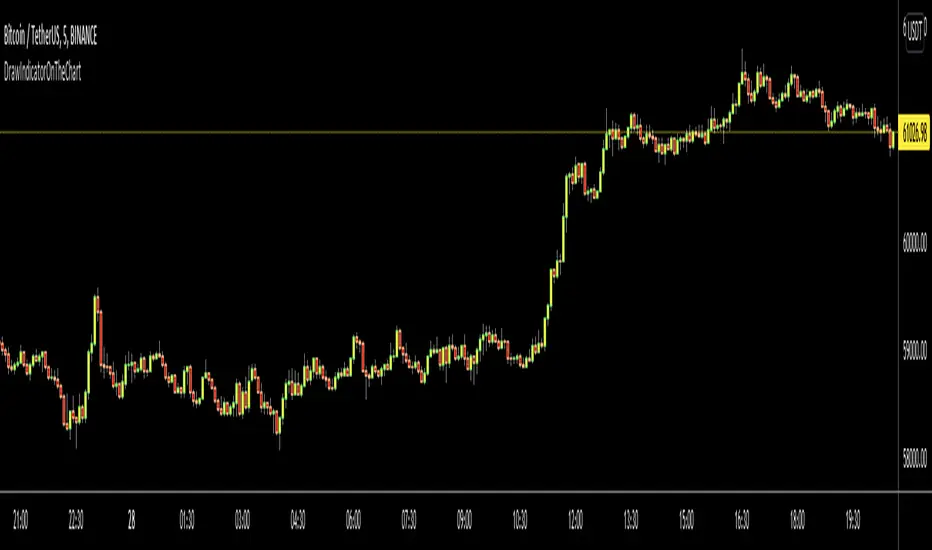
this library is used to show an indicator (such RSI, CCI, MOM etc) on the main chart with indicator's horizontal lines in a window. Location of the window is calculated dynamically by last price movemements
drawIndicator(indicatorName, indicator, indicatorcolor, period, indimax_, indimin_, levels, precision, xlocation) draws the related indicator on the chart
Parameters:
indicatorName: is the indicator name as string such "RSI", "CCI" etc
indicator: is the indicator you want to show, such rsi(close, 14), mom(close, 10) etc
indicatorcolor: is the color of indicator line
period: is the length of the window to show
indimax_: is the maximum value of the indicator, for example for RSI it's 100.0, if the indicator (such CCI, MOM etc) doesn't have maximum value then use "na"
indimin_: is the minimum value of the indicator, for example for RSI it's 0.0, if the indicator (such CCI, MOM etc)doesn't have maximum value then use "na"
levels: is the levels of the array for the horizontal lines. for example if you want horizontal lines at 30.0, and 70.0 then use array.from(30.0, 70.0). if no horizontal lines then use array.from(na)
precision: is the precision/number of decimals that is used to show indicator values, for example for RSI set it 2
xlocation: is end location of the indicator window, for example if xlocation = 0 window is created on the index of the last bar/candle
Returns: none
릴리즈 노트
v2background color of the window changed as black
릴리즈 노트
v3릴리즈 노트
v4릴리즈 노트
v5: - updated to show multiple indicator lines for the indicators such DMI
- so indicator parameter changed to indicator1, indicator2, indicator3 (if indicator2 or indicator3 doesn't exist then send na value)
- added line width parameter
- color parameter changed to the array
Updated:
drawIndicator(enabled, indicatorName, indicator1, indicator2, indicator3, indicatorcolor, period, indimax_, indimin_, levels, precision, xlocation, lnwidth) draws the related indicator on the chart
Parameters:
enabled: if it's enabled to show
indicatorName: is the indicator name as string such "RSI", "CCI" etc
indicator1: is first indicator you want to show, such rsi(close, 14), mom(close, 10) etc
indicator2: is second indicator you want to show, such -DI of DMI
indicator3: is third indicator you want to show, such ADX of DMI
indicatorcolor: is the color of indicator line
period: is the length of the window to show
indimax_: is the maximum value of the indicator, for example for RSI it's 100.0, if the indicator (such CCI, MOM etc) doesn't have maximum value then use "na"
indimin_: is the minimum value of the indicator, for example for RSI it's 0.0, if the indicator (such CCI, MOM etc)doesn't have maximum value then use "na"
levels: is the levels of the array for the horizontal lines. for example if you want horizontal lines at 30.0, and 70.0 then use array.from(30.0, 70.0). if no horizontal lines then use array.from(na)
precision: is the precision/nuber of decimals that is used to show indicator values, for example for RSI set it 2
xlocation: is end location of the indicator window, for example if xlocation = 0 window is created on the index of the last bar/candle
lnwidth: is the line width of the indicator lines
Returns: none
릴리즈 노트
v6Somehow indicator doesn't show the lines. fixed. Thank to TanHef for the solution
파인 라이브러리
트레이딩뷰의 진정한 정신에 따라, 작성자는 이 파인 코드를 오픈소스 라이브러리로 게시하여 커뮤니티의 다른 파인 프로그래머들이 재사용할 수 있도록 했습니다. 작성자에게 경의를 표합니다! 이 라이브러리는 개인적으로 사용하거나 다른 오픈소스 게시물에서 사용할 수 있지만, 이 코드의 게시물 내 재사용은 하우스 룰에 따라 규제됩니다.
🤝 LonesomeTheBlue community
t.me/LonesomeTheBlue_Official
🎦 YouTube Channel
Youtube.com/@lonesometheblue/videos
💰 Subscription to Pro indicators
Tradingview.com/spaces/LonesomeTheBlue/
t.me/LonesomeTheBlue_Official
🎦 YouTube Channel
Youtube.com/@lonesometheblue/videos
💰 Subscription to Pro indicators
Tradingview.com/spaces/LonesomeTheBlue/
면책사항
해당 정보와 게시물은 금융, 투자, 트레이딩 또는 기타 유형의 조언이나 권장 사항으로 간주되지 않으며, 트레이딩뷰에서 제공하거나 보증하는 것이 아닙니다. 자세한 내용은 이용 약관을 참조하세요.