OPEN-SOURCE SCRIPT
업데이트됨 FACTOR MONITOR
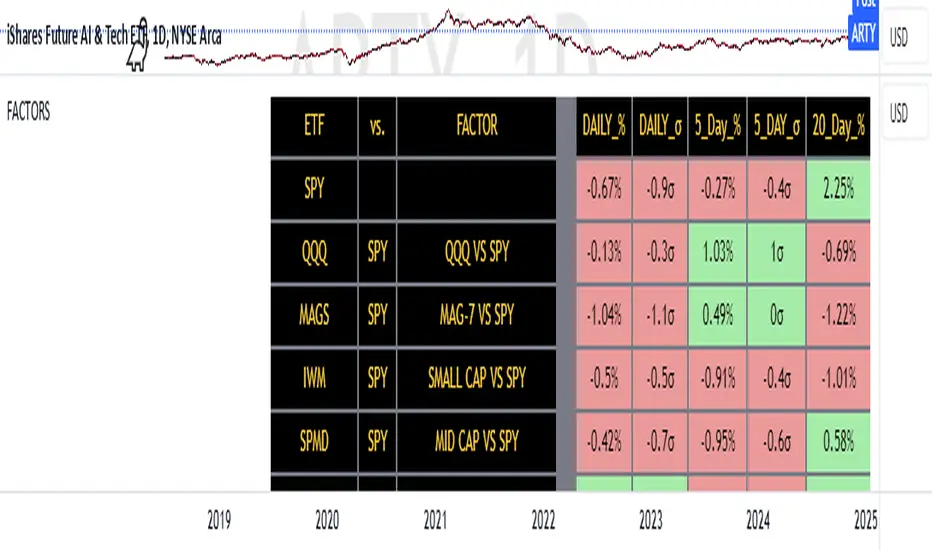
The Factor Monitor is a comprehensive designed to track relative strength and standard deviation movements across multiple market segments and investment factors. The indicator calculates and displays normalized percentage moves and their statistical significance (measured in standard deviations) across daily, 5-day, and 20-day periods, providing a multi-timeframe view of market dynamics.
Key Features:
Real-time tracking of relative performance between various ETF pairs (e.g., QQQ vs SPY, IWM vs SPY)
Standard deviation scoring system that identifies statistically significant moves
Color-coded visualization (green/red) for quick interpretation of relative strength
Multiple timeframe analysis (1-day, 5-day, and 20-day moves)
Monitoring of key market segments:
Style factors (Value, Growth, Momentum)
Market cap segments (Large, Mid, Small)
Sector relative strength
Risk factors (High Beta vs Low Volatility)
Credit conditions (High Yield vs Investment Grade)
The tool is particularly valuable for:
Identifying significant factor rotations in the market
Assessing market breadth through relative strength comparisons
Spotting potential trend changes through statistical deviation analysis
Monitoring sector leadership and market regime shifts
Quantifying the magnitude of market moves relative to historical norms
릴리즈 노트
Just changed colors around to make more readable릴리즈 노트
Updated MAGS exchange오픈 소스 스크립트
트레이딩뷰의 진정한 정신에 따라, 이 스크립트의 작성자는 이를 오픈소스로 공개하여 트레이더들이 기능을 검토하고 검증할 수 있도록 했습니다. 작성자에게 찬사를 보냅니다! 이 코드는 무료로 사용할 수 있지만, 코드를 재게시하는 경우 하우스 룰이 적용된다는 점을 기억하세요.
면책사항
해당 정보와 게시물은 금융, 투자, 트레이딩 또는 기타 유형의 조언이나 권장 사항으로 간주되지 않으며, 트레이딩뷰에서 제공하거나 보증하는 것이 아닙니다. 자세한 내용은 이용 약관을 참조하세요.
오픈 소스 스크립트
트레이딩뷰의 진정한 정신에 따라, 이 스크립트의 작성자는 이를 오픈소스로 공개하여 트레이더들이 기능을 검토하고 검증할 수 있도록 했습니다. 작성자에게 찬사를 보냅니다! 이 코드는 무료로 사용할 수 있지만, 코드를 재게시하는 경우 하우스 룰이 적용된다는 점을 기억하세요.
면책사항
해당 정보와 게시물은 금융, 투자, 트레이딩 또는 기타 유형의 조언이나 권장 사항으로 간주되지 않으며, 트레이딩뷰에서 제공하거나 보증하는 것이 아닙니다. 자세한 내용은 이용 약관을 참조하세요.