OPEN-SOURCE SCRIPT
업데이트됨 Modified ATR Indicator [KL]
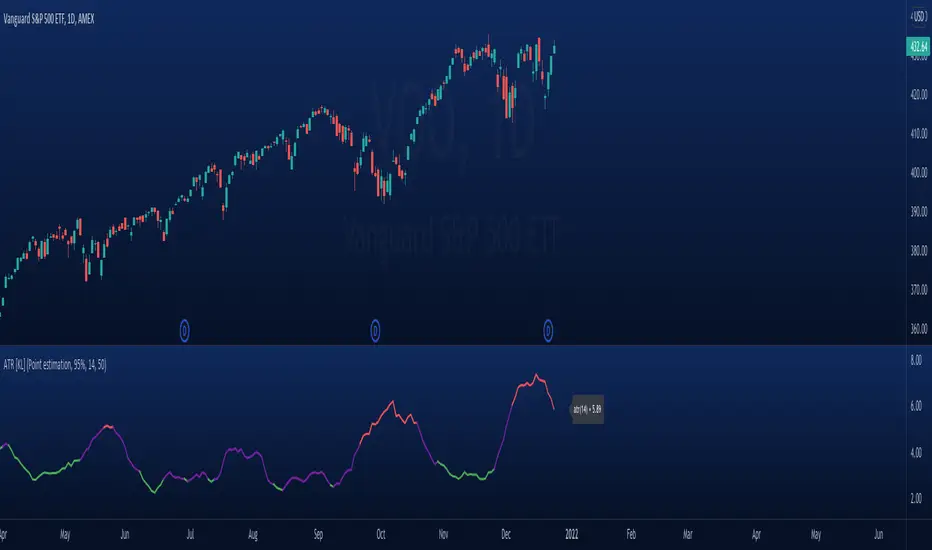
Modified Average True Range (ATR) Indicator
This indicator displays the ATR with relative highs and relative lows statistically determined.
What is ATR:
To know what ATR is, we need to understand what a True Range (TR) is.
- TR at a given bar is the highest distance between points: a) High vs low, b) High vs Close, and c) Low vs Close.
- ATR is the moving average of TRs over a predefined lookback period; 14 is the most commonly used.
- ATR can be mathematically expressed as:

Why is ATR Important
ATR often used to measure volatility; high volatility is indicated by high ATR, vice versa for low. This is a versatile tool allowing traders to determine entry/exit points, as well as the size of stop losses and when to take profits relative to it.
This is an opinion: Through observations, I have noticed that ATR can also indirectly tell us the levels of relative volume. This intuitively makes sense because in order to increase length of TR, high amounts of capital inflow/outflow is required (graphically speaking, high volume is required in order to make lengths of candle sticks longer). The relationship between ATR and relative volume should hold unless the market is illiquid to the extreme that there is no relationship between volume and price.
That said, knowing the relative lows/highs of ATR is very useful. It can be interpreted as:
- Relative high = high volatility, usually during sell offs
- Relative low = decreasing volume, could indicate price consolidation
Instead of arbitrarily determining whether ATR is high/low, this indicator will determine relative highs and relative lows using a simple statistical model.
How relative high/low is determined by this model
This indicator applies two-tailed hypothesis testing to test whether ATR (ie. say lookback of 14) has greatly deviated from a larger sample size (ie. lookback of 50). Assuming ATR is normally distributed and variance is known, then test statistic (z) can be used to determine whether ATR14 is within the critical area under Null Hypothesis: ATR14 == ATR50. If z falls below/above the left/right critical values (ie. 1.645 for a 90% confidence interval), then this is shown by the indicator through using different colors to plot the ATR line.
This indicator displays the ATR with relative highs and relative lows statistically determined.
What is ATR:
To know what ATR is, we need to understand what a True Range (TR) is.
- TR at a given bar is the highest distance between points: a) High vs low, b) High vs Close, and c) Low vs Close.
- ATR is the moving average of TRs over a predefined lookback period; 14 is the most commonly used.
- ATR can be mathematically expressed as:
Why is ATR Important
ATR often used to measure volatility; high volatility is indicated by high ATR, vice versa for low. This is a versatile tool allowing traders to determine entry/exit points, as well as the size of stop losses and when to take profits relative to it.
This is an opinion: Through observations, I have noticed that ATR can also indirectly tell us the levels of relative volume. This intuitively makes sense because in order to increase length of TR, high amounts of capital inflow/outflow is required (graphically speaking, high volume is required in order to make lengths of candle sticks longer). The relationship between ATR and relative volume should hold unless the market is illiquid to the extreme that there is no relationship between volume and price.
That said, knowing the relative lows/highs of ATR is very useful. It can be interpreted as:
- Relative high = high volatility, usually during sell offs
- Relative low = decreasing volume, could indicate price consolidation
Instead of arbitrarily determining whether ATR is high/low, this indicator will determine relative highs and relative lows using a simple statistical model.
How relative high/low is determined by this model
This indicator applies two-tailed hypothesis testing to test whether ATR (ie. say lookback of 14) has greatly deviated from a larger sample size (ie. lookback of 50). Assuming ATR is normally distributed and variance is known, then test statistic (z) can be used to determine whether ATR14 is within the critical area under Null Hypothesis: ATR14 == ATR50. If z falls below/above the left/right critical values (ie. 1.645 for a 90% confidence interval), then this is shown by the indicator through using different colors to plot the ATR line.
릴리즈 노트
Amended: Confidence interval -> Critical values Mapping릴리즈 노트
Added "Point estimation model", can be selected in Settings -> Inputs -> Model. For details, refer to the inline code documentations.릴리즈 노트
Added label attached to the last bar showing current atr(len) value.오픈 소스 스크립트
트레이딩뷰의 진정한 정신에 따라, 이 스크립트의 작성자는 이를 오픈소스로 공개하여 트레이더들이 기능을 검토하고 검증할 수 있도록 했습니다. 작성자에게 찬사를 보냅니다! 이 코드는 무료로 사용할 수 있지만, 코드를 재게시하는 경우 하우스 룰이 적용된다는 점을 기억하세요.
면책사항
해당 정보와 게시물은 금융, 투자, 트레이딩 또는 기타 유형의 조언이나 권장 사항으로 간주되지 않으며, 트레이딩뷰에서 제공하거나 보증하는 것이 아닙니다. 자세한 내용은 이용 약관을 참조하세요.
오픈 소스 스크립트
트레이딩뷰의 진정한 정신에 따라, 이 스크립트의 작성자는 이를 오픈소스로 공개하여 트레이더들이 기능을 검토하고 검증할 수 있도록 했습니다. 작성자에게 찬사를 보냅니다! 이 코드는 무료로 사용할 수 있지만, 코드를 재게시하는 경우 하우스 룰이 적용된다는 점을 기억하세요.
면책사항
해당 정보와 게시물은 금융, 투자, 트레이딩 또는 기타 유형의 조언이나 권장 사항으로 간주되지 않으며, 트레이딩뷰에서 제공하거나 보증하는 것이 아닙니다. 자세한 내용은 이용 약관을 참조하세요.