INVITE-ONLY SCRIPT
Option Trend for Nifty & Bank Nifty (Indian Market)
This is an advanced multi-system trading indicator for TradingView, offering a comprehensive suite of tools for technical analysis and trading decision support[search_files_v2:1].
Main Features
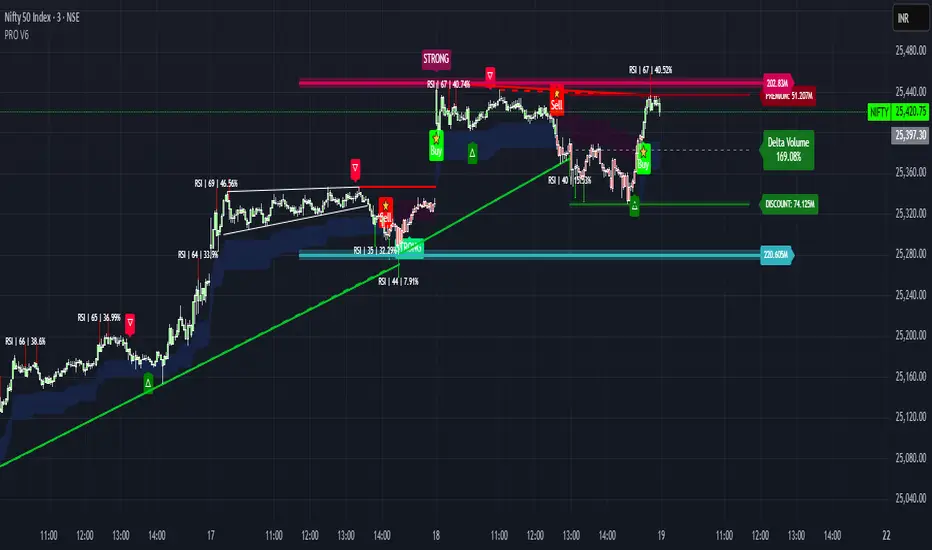
Trendline Detection: Identifies bullish and bearish trendlines automatically using swing highs and lows, with optional labeling of key price structure (Higher Highs, Lower Lows, etc.) and customizable line colors and styles.
Signal & Trend Systems: Includes both a crossover signal system (for buy/sell entries) and a multi-period trend-following system, which uses enhanced moving averages and dynamic trailing levels to adapt to different market conditions.
Supply & Demand Zones: Automatically detects and marks potential supply and demand zones based on pivot structures and ATR buffers, helping spot logical areas for price reaction or reversal.
Support & Resistance: Plots periodic support/resistance and macro (long-term) levels, with user-defined periods and the ability to visualize volume delta for each zone.
Theil-Sen Estimator: Optionally adds a statistical regression channel using the robust Theil-Sen method to identify trend direction and breaks for long-term analysis.
RSI/KDE Analysis: Implements relative strength index (RSI) analysis with kernel density estimation (KDE) to detect pivot points with probability labeling and color-coded signals for high-confidence reversals.
Dashboards & Alerts: Provides multitimeframe dashboards summarizing trend, EMA signals, and momentum across up to five timeframes, plus integrated alerting for all major events (entries, exits, zone breaks, etc.).
Customization & Usability
Extensive input settings for periods, color themes, line widths, and label visibility.
Can display visual cloud bands, trend ribbons, and supply/demand boxes as overlays on price charts for enhanced clarity.
Open-source and for educational use under permissive licensing, not affiliated with TradingView.
This indicator is designed to deliver a full-featured market map, combining price action, trend, support/resistance, and probabilistic signals for discretionary or semi-automated trading.
Main Features
Trendline Detection: Identifies bullish and bearish trendlines automatically using swing highs and lows, with optional labeling of key price structure (Higher Highs, Lower Lows, etc.) and customizable line colors and styles.
Signal & Trend Systems: Includes both a crossover signal system (for buy/sell entries) and a multi-period trend-following system, which uses enhanced moving averages and dynamic trailing levels to adapt to different market conditions.
Supply & Demand Zones: Automatically detects and marks potential supply and demand zones based on pivot structures and ATR buffers, helping spot logical areas for price reaction or reversal.
Support & Resistance: Plots periodic support/resistance and macro (long-term) levels, with user-defined periods and the ability to visualize volume delta for each zone.
Theil-Sen Estimator: Optionally adds a statistical regression channel using the robust Theil-Sen method to identify trend direction and breaks for long-term analysis.
RSI/KDE Analysis: Implements relative strength index (RSI) analysis with kernel density estimation (KDE) to detect pivot points with probability labeling and color-coded signals for high-confidence reversals.
Dashboards & Alerts: Provides multitimeframe dashboards summarizing trend, EMA signals, and momentum across up to five timeframes, plus integrated alerting for all major events (entries, exits, zone breaks, etc.).
Customization & Usability
Extensive input settings for periods, color themes, line widths, and label visibility.
Can display visual cloud bands, trend ribbons, and supply/demand boxes as overlays on price charts for enhanced clarity.
Open-source and for educational use under permissive licensing, not affiliated with TradingView.
This indicator is designed to deliver a full-featured market map, combining price action, trend, support/resistance, and probabilistic signals for discretionary or semi-automated trading.
초대 전용 스크립트
이 스크립트는 작성자가 승인한 사용자만 접근할 수 있습니다. 사용하려면 요청 후 승인을 받아야 하며, 일반적으로 결제 후에 허가가 부여됩니다. 자세한 내용은 아래 작성자의 안내를 따르거나 balagan93에게 직접 문의하세요.
트레이딩뷰는 스크립트의 작동 방식을 충분히 이해하고 작성자를 완전히 신뢰하지 않는 이상, 해당 스크립트에 비용을 지불하거나 사용하는 것을 권장하지 않습니다. 커뮤니티 스크립트에서 무료 오픈소스 대안을 찾아보실 수도 있습니다.
작성자 지시 사항
Access is provided only to approved users.
Please message me via TradingView with:
Your username
Proof of subscription/payment (if applicable)
Any questions or feedback
Requests without these details may be declined.
면책사항
해당 정보와 게시물은 금융, 투자, 트레이딩 또는 기타 유형의 조언이나 권장 사항으로 간주되지 않으며, 트레이딩뷰에서 제공하거나 보증하는 것이 아닙니다. 자세한 내용은 이용 약관을 참조하세요.