PROTECTED SOURCE SCRIPT
Yanirax Model (YNRX)
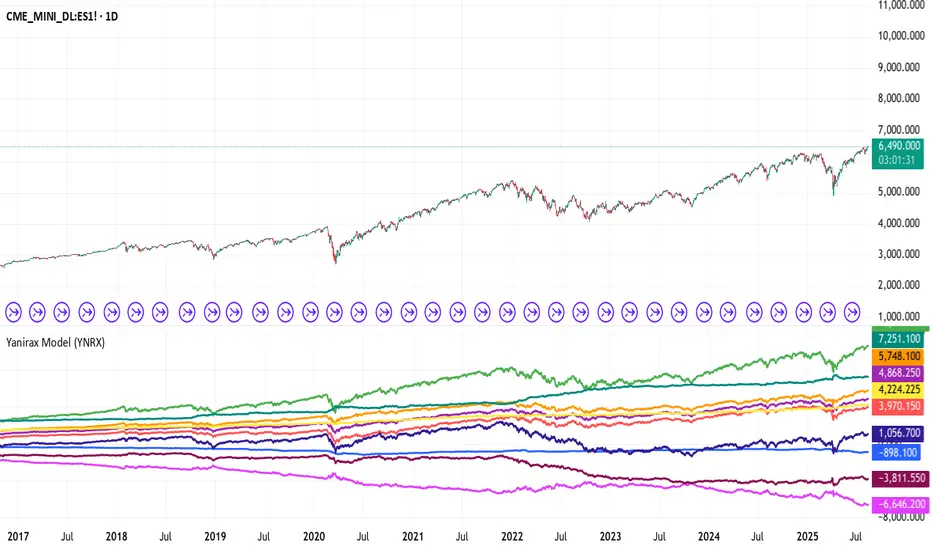
The Yanirax Model (YNRX) is a quantitative analysis tool designed to detect market lows and highs for a multitude of financial assets. This script calculates and accumulates (cumulative computation) a series of metrics in both absolute values and logarithmic percentages, allowing patterns to be identified that detect market highs and lows.
Calculations and models included
- Gap (G) – Difference between the previous opening and closing prices.
- Market (M) – Intraday movement from opening to closing.
- Total Market (TM) – Difference between the current closing price and the previous closing price.
- G-M (YNRX) – Ratio between Gap and Market.
- TM+M (YNRX) – Sum of Total Market and Market.
- TM+G (YNRX) – Sum of Total Market and Gap.
- MBI – Relative average based on candlestick highs and lows.
- RSG – Difference between positive and negative movements measured from highs and lows.
- YNRY 1 – Accumulation of directional range conditioned by the Total Market trend.
- YNRY 2 – Variations of YNRY 1 adjusted with Total Market, Market, or Gap.
- Version in % – All of the above metrics are also calculated on a logarithmic basis, expressed as cumulative percentages.
Display
The script allows you to choose the variables and models you want to use, with blocks such as gap, market, and total market available, or you can use these three together with models such as YNRX, YNRY, RSG, or MBI.
Intended use
This indicator does not generate buy or sell signals on its own. Its purpose is to provide a statistical and structural view of market behavior so that users can integrate it into their own technical analysis and detect turning points.
보호된 스크립트입니다
이 스크립트는 비공개 소스로 게시됩니다. 하지만 이를 자유롭게 제한 없이 사용할 수 있습니다 – 자세한 내용은 여기에서 확인하세요.
면책사항
해당 정보와 게시물은 금융, 투자, 트레이딩 또는 기타 유형의 조언이나 권장 사항으로 간주되지 않으며, 트레이딩뷰에서 제공하거나 보증하는 것이 아닙니다. 자세한 내용은 이용 약관을 참조하세요.
면책사항
해당 정보와 게시물은 금융, 투자, 트레이딩 또는 기타 유형의 조언이나 권장 사항으로 간주되지 않으며, 트레이딩뷰에서 제공하거나 보증하는 것이 아닙니다. 자세한 내용은 이용 약관을 참조하세요.