OPEN-SOURCE SCRIPT
Midpoint of Last 3 Candles
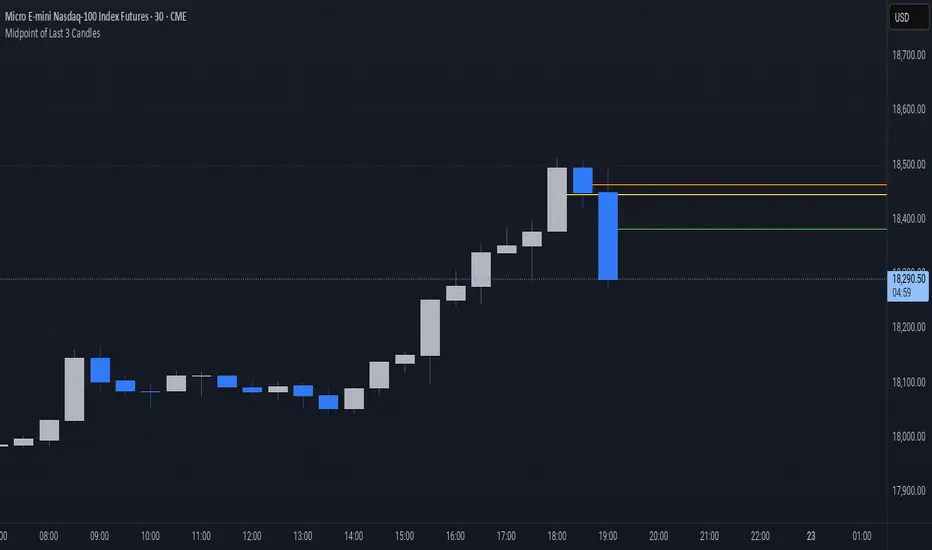
This indicator highlights the market structure by plotting the midpoints of the current and previous two candles. It draws a horizontal line at the average of the high and low for each of these candles, giving a visual cue of the short-term balance point in price action. These midpoints can act as dynamic support and resistance levels, helping traders assess areas of potential reaction or continuation.
Each line is color-coded for clarity: green represents the current candle, orange marks the previous candle, and yellow indicates the one before that. All lines extend into the future on the chart, allowing you to see how price interacts with these levels as new candles form. This simple yet effective tool can be useful in various strategies, especially those focused on price action, scalping, or intraday analysis.
Each line is color-coded for clarity: green represents the current candle, orange marks the previous candle, and yellow indicates the one before that. All lines extend into the future on the chart, allowing you to see how price interacts with these levels as new candles form. This simple yet effective tool can be useful in various strategies, especially those focused on price action, scalping, or intraday analysis.
오픈 소스 스크립트
트레이딩뷰의 진정한 정신에 따라, 이 스크립트의 작성자는 이를 오픈소스로 공개하여 트레이더들이 기능을 검토하고 검증할 수 있도록 했습니다. 작성자에게 찬사를 보냅니다! 이 코드는 무료로 사용할 수 있지만, 코드를 재게시하는 경우 하우스 룰이 적용된다는 점을 기억하세요.
면책사항
해당 정보와 게시물은 금융, 투자, 트레이딩 또는 기타 유형의 조언이나 권장 사항으로 간주되지 않으며, 트레이딩뷰에서 제공하거나 보증하는 것이 아닙니다. 자세한 내용은 이용 약관을 참조하세요.
오픈 소스 스크립트
트레이딩뷰의 진정한 정신에 따라, 이 스크립트의 작성자는 이를 오픈소스로 공개하여 트레이더들이 기능을 검토하고 검증할 수 있도록 했습니다. 작성자에게 찬사를 보냅니다! 이 코드는 무료로 사용할 수 있지만, 코드를 재게시하는 경우 하우스 룰이 적용된다는 점을 기억하세요.
면책사항
해당 정보와 게시물은 금융, 투자, 트레이딩 또는 기타 유형의 조언이나 권장 사항으로 간주되지 않으며, 트레이딩뷰에서 제공하거나 보증하는 것이 아닙니다. 자세한 내용은 이용 약관을 참조하세요.