OPEN-SOURCE SCRIPT
업데이트됨 DECODE Global Liquidity Index
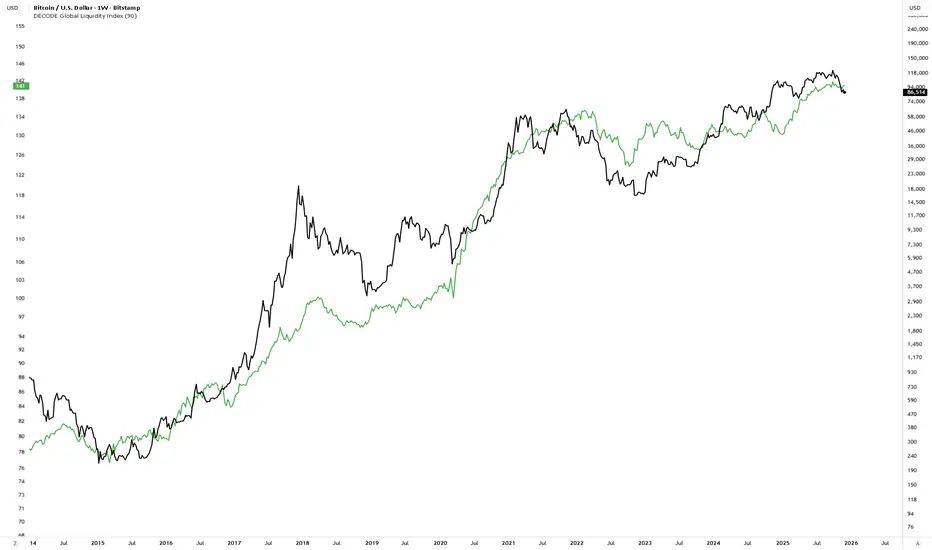
DECODE Global Liquidity Index 🌊
The DECODE Global Liquidity Index is a powerful tool designed to track and aggregate global liquidity by combining data from the world's 13 largest economies. It offers a comprehensive view of financial liquidity, providing crucial insights into the underlying currents that can influence asset prices and market trends.
The economies covered are: United States, China, European Union, Japan, India, United Kingdom, Brazil, Canada, Russia, South Korea, Australia, Mexico, and Indonesia. The European Union accounts for major individual economies within the EU like Germany, France, Italy, Spain, Netherlands, Poland, etc.
Key Features:
1. Customizable Liquidity Sources
2. Lead/Lag Analysis (Forward Projection):
3. Rate of Change (RoC) Oscillator:
Year-over-Year % View: Instead of viewing aggregate liquidity, you can switch to a Year-over-Year (YoY%) Rate of Change (ROC) oscillator.
Why it's useful:
This indicator aims to provide a clear, customizable, and insightful measure of global liquidity to aid traders and investors in their market analysis.
The DECODE Global Liquidity Index is a powerful tool designed to track and aggregate global liquidity by combining data from the world's 13 largest economies. It offers a comprehensive view of financial liquidity, providing crucial insights into the underlying currents that can influence asset prices and market trends.
The economies covered are: United States, China, European Union, Japan, India, United Kingdom, Brazil, Canada, Russia, South Korea, Australia, Mexico, and Indonesia. The European Union accounts for major individual economies within the EU like Germany, France, Italy, Spain, Netherlands, Poland, etc.
Key Features:
1. Customizable Liquidity Sources
- Include Global M2: You can opt to include the M2 money supply from the 13 listed economies. M2 is a broad measure of money supply that includes cash, checking deposits, savings deposits, money market securities, mutual funds, and other time deposits. (Note: Australia uses M3 as its primary measure, which is included when M2 is selected for Australia).
- Include Central Bank Balance Sheets (CBBS): Alternatively, or in addition, you can include the total assets held by the central banks of these economies. Central bank balance sheets expand or contract based on monetary policy operations like quantitative easing (QE) or tightening (QT).
- Combined View: If you select both M2 and CBBS, and data is available for both, the indicator will display an average of the two aggregated values. If only one source type is selected, or if data for one type is unavailable despite both being selected, the indicator will display the single available and selected component. This provides flexibility in how you define and analyze global liquidity.
2. Lead/Lag Analysis (Forward Projection):
- Lead Offset (Days): This feature allows you to project the liquidity index forward by a specified number of days.
- Why it's useful: Global liquidity changes can often be a leading indicator for various asset classes, particularly those sensitive to risk appetite, like Bitcoin or growth stocks. These assets might lag shifts in liquidity. By applying a lead (e.g., 90 days), you can shift the liquidity data forward on your chart to more easily visualize potential correlations and identify if current asset price movements might be responding to past changes in liquidity.
3. Rate of Change (RoC) Oscillator:
Year-over-Year % View: Instead of viewing aggregate liquidity, you can switch to a Year-over-Year (YoY%) Rate of Change (ROC) oscillator.
Why it's useful:
- Momentum Identification: The ROC highlights the speed and direction of liquidity changes. Positive values indicate liquidity is increasing compared to a year ago, while negative values show it's decreasing.
- Turning Points: Oscillators make it easier to spot potential accelerations, decelerations, or reversals in liquidity trends. A cross above the zero line can signal strengthening liquidity momentum, while a cross below can signal weakening momentum.
- Cycle Analysis: It helps in assessing the cyclical nature of liquidity provision and its potential impact on market cycles.
This indicator aims to provide a clear, customizable, and insightful measure of global liquidity to aid traders and investors in their market analysis.
릴리즈 노트
Bug fix릴리즈 노트
Added US Treasury General Account and Reverse Repurchase Agreements. These are subtractions from the overall liquidity calculation.릴리즈 노트
Bug fixes릴리즈 노트
Updated the default settings for the most comprehensive view릴리즈 노트
Fixed a small bug with colouring of the liquidity lead when applying an offset.오픈 소스 스크립트
트레이딩뷰의 진정한 정신에 따라, 이 스크립트의 작성자는 이를 오픈소스로 공개하여 트레이더들이 기능을 검토하고 검증할 수 있도록 했습니다. 작성자에게 찬사를 보냅니다! 이 코드는 무료로 사용할 수 있지만, 코드를 재게시하는 경우 하우스 룰이 적용된다는 점을 기억하세요.
면책사항
해당 정보와 게시물은 금융, 투자, 트레이딩 또는 기타 유형의 조언이나 권장 사항으로 간주되지 않으며, 트레이딩뷰에서 제공하거나 보증하는 것이 아닙니다. 자세한 내용은 이용 약관을 참조하세요.
오픈 소스 스크립트
트레이딩뷰의 진정한 정신에 따라, 이 스크립트의 작성자는 이를 오픈소스로 공개하여 트레이더들이 기능을 검토하고 검증할 수 있도록 했습니다. 작성자에게 찬사를 보냅니다! 이 코드는 무료로 사용할 수 있지만, 코드를 재게시하는 경우 하우스 룰이 적용된다는 점을 기억하세요.
면책사항
해당 정보와 게시물은 금융, 투자, 트레이딩 또는 기타 유형의 조언이나 권장 사항으로 간주되지 않으며, 트레이딩뷰에서 제공하거나 보증하는 것이 아닙니다. 자세한 내용은 이용 약관을 참조하세요.