PROTECTED SOURCE SCRIPT
RSI Bitmap
Function (English):
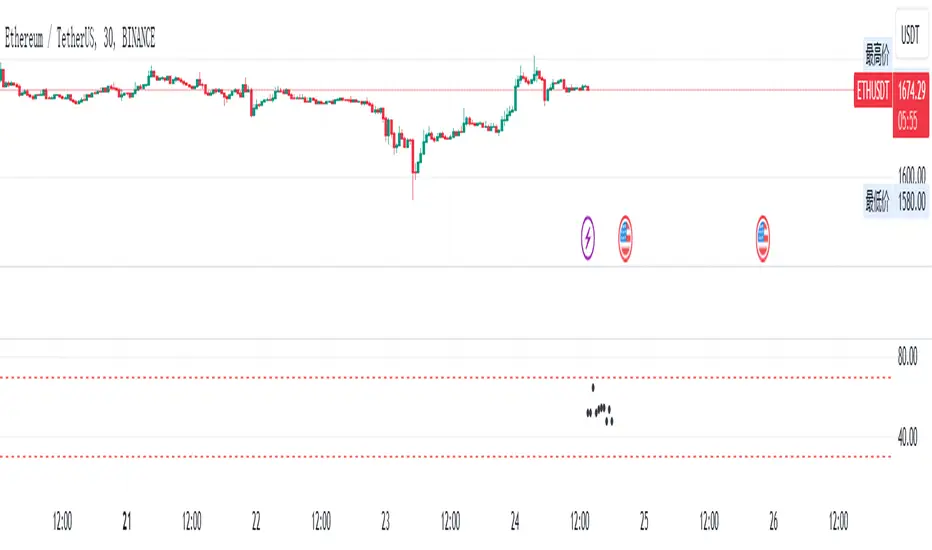
1. It displays 40 items’(tokens,stocks, futures etc.) RSI oversold and overbought data in the form of bitmap/dots on the chart.
2. The specifi item will be clear after placing mouse on the small dots.
3. The bitmap will show red when the RSI overbought, show green when the RSI oversold, and will show black when the RSI in the middle of the value.
RSI点阵图功能(中文):
功能:
1、在图表上以点阵形式、直观的显示40支商品的RSI超卖超买数据
2、如果需要查看具体是什么商品,直接把鼠标放置在小点上就行
3、当RSI超买时点阵显示红色、当RSI超卖时点阵电视绿色、处于中间则显示黑色
보호된 스크립트입니다
이 스크립트는 비공개 소스로 게시됩니다. 하지만 이를 자유롭게 제한 없이 사용할 수 있습니다 – 자세한 내용은 여기에서 확인하세요.
면책사항
해당 정보와 게시물은 금융, 투자, 트레이딩 또는 기타 유형의 조언이나 권장 사항으로 간주되지 않으며, 트레이딩뷰에서 제공하거나 보증하는 것이 아닙니다. 자세한 내용은 이용 약관을 참조하세요.
면책사항
해당 정보와 게시물은 금융, 투자, 트레이딩 또는 기타 유형의 조언이나 권장 사항으로 간주되지 않으며, 트레이딩뷰에서 제공하거나 보증하는 것이 아닙니다. 자세한 내용은 이용 약관을 참조하세요.