OPEN-SOURCE SCRIPT
MAD Ratio with Buy/Sell Signals
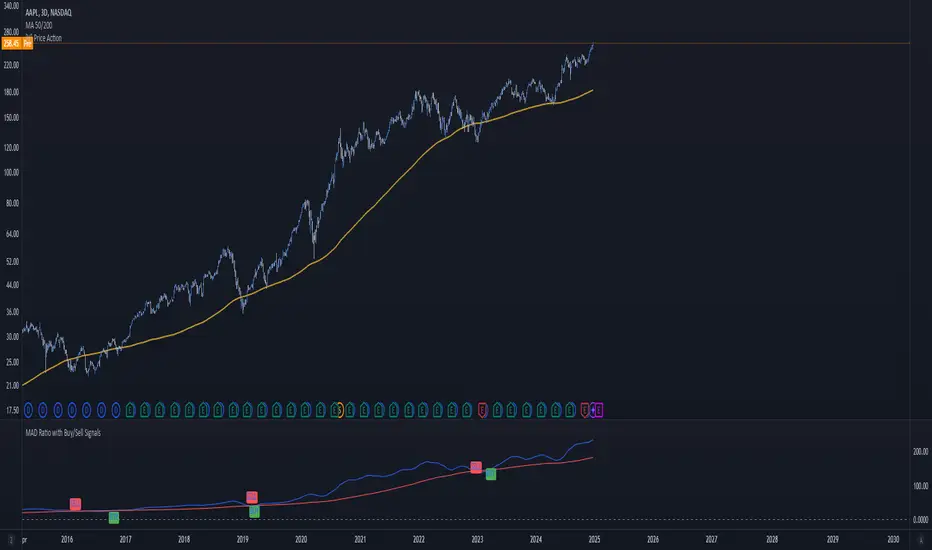
This code creates an indicator that generates Buy and Sell signals based on the Moving Average Distance (MAD) Ratio and the crossover/crossunder of two Simple Moving Averages (SMA). Here's a breakdown of what it does:
What the Indicator Shows:
Moving Averages:
21-day SMA (shortMA): Plotted in blue.
200-day SMA (longMA): Plotted in red.
These lines visually represent short-term and long-term trends in price.
Horizontal Reference Line:
A gray horizontal line at Ratio = 1 marks when the 21-day SMA and 200-day SMA are equal. This is the neutral point for the MAD ratio.
Buy and Sell Signals:
Buy Signal (Green Label):
Triggered when:
MAD Ratio > 1 (shortMA is greater than longMA, indicating upward momentum).
The 21-day SMA crosses above the 200-day SMA.
Displays a green "BUY" label below the price chart.
Sell Signal (Red Label):
Triggered when:
MAD Ratio < 1 (shortMA is less than longMA, indicating downward momentum).
The 21-day SMA crosses below the 200-day SMA.
Displays a red "SELL" label above the price chart.
오픈 소스 스크립트
트레이딩뷰의 진정한 정신에 따라, 이 스크립트의 작성자는 이를 오픈소스로 공개하여 트레이더들이 기능을 검토하고 검증할 수 있도록 했습니다. 작성자에게 찬사를 보냅니다! 이 코드는 무료로 사용할 수 있지만, 코드를 재게시하는 경우 하우스 룰이 적용된다는 점을 기억하세요.
면책사항
해당 정보와 게시물은 금융, 투자, 트레이딩 또는 기타 유형의 조언이나 권장 사항으로 간주되지 않으며, 트레이딩뷰에서 제공하거나 보증하는 것이 아닙니다. 자세한 내용은 이용 약관을 참조하세요.
오픈 소스 스크립트
트레이딩뷰의 진정한 정신에 따라, 이 스크립트의 작성자는 이를 오픈소스로 공개하여 트레이더들이 기능을 검토하고 검증할 수 있도록 했습니다. 작성자에게 찬사를 보냅니다! 이 코드는 무료로 사용할 수 있지만, 코드를 재게시하는 경우 하우스 룰이 적용된다는 점을 기억하세요.
면책사항
해당 정보와 게시물은 금융, 투자, 트레이딩 또는 기타 유형의 조언이나 권장 사항으로 간주되지 않으며, 트레이딩뷰에서 제공하거나 보증하는 것이 아닙니다. 자세한 내용은 이용 약관을 참조하세요.