OPEN-SOURCE SCRIPT
oi + funding oscillator cryptosmart
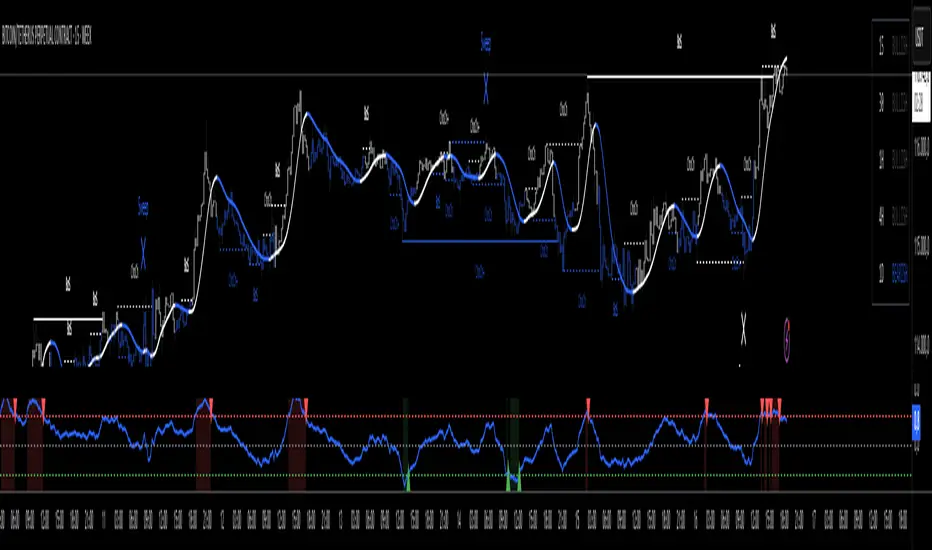
The oi + funding oscillator cryptosmart is an advanced momentum tool designed to gauge sentiment in the crypto derivatives market. It combines Open Interest (OI) changes with Funding Rates, normalizes them into a single oscillator using a z-score, and identifies potential market extremes.
This provides traders with a powerful visual guide to spot when the market is over-leveraged (overheated) or when a significant deleveraging event has occurred (oversold), signaling potential reversals.
How It Works
Combined Data: The indicator tracks the rate of change in Open Interest and the value of Funding Rates.
Oscillator: It blends these two data points into a single, smoothed oscillator line that moves above and below a zero line.
Extreme Zones:
Overheated (Red Zone): When the oscillator enters the upper critical zone, it suggests excessive greed and high leverage, increasing the risk of a sharp correction (long squeeze). A cross below this level generates a potential sell signal.
Oversold (Green Zone): When the oscillator enters the lower critical zone, it indicates panic, liquidations, and a potential market bottom. A cross above this level generates a potential buy signal.
Trading Strategy & Timeframes
This oscillator is designed to be versatile, but its effectiveness can vary depending on the timeframe.
Optimal Timeframes (1H and 4H): The indicator has shown its highest effectiveness on the 1-hour and 4-hour charts. These timeframes are ideal for capturing significant shifts in market sentiment reflected in OI and funding data, filtering out short-term noise while still providing timely reversal signals.
Lower Timeframes (e.g., 1-min, 5-min, 15-min): On shorter timeframes, the oscillator is still a highly effective tool, but it is best used as a confluence factor within a broader trading system. Due to the increased noise on these charts, it is not recommended to use its signals in isolation. Instead, use it as a final argument for entry. For example, if your primary scalping strategy gives you a buy signal, you can check if the oscillator is also exiting the oversold (green) zone to add a powerful layer of confirmation to your trade.
오픈 소스 스크립트
트레이딩뷰의 진정한 정신에 따라, 이 스크립트의 작성자는 이를 오픈소스로 공개하여 트레이더들이 기능을 검토하고 검증할 수 있도록 했습니다. 작성자에게 찬사를 보냅니다! 이 코드는 무료로 사용할 수 있지만, 코드를 재게시하는 경우 하우스 룰이 적용된다는 점을 기억하세요.
면책사항
해당 정보와 게시물은 금융, 투자, 트레이딩 또는 기타 유형의 조언이나 권장 사항으로 간주되지 않으며, 트레이딩뷰에서 제공하거나 보증하는 것이 아닙니다. 자세한 내용은 이용 약관을 참조하세요.
오픈 소스 스크립트
트레이딩뷰의 진정한 정신에 따라, 이 스크립트의 작성자는 이를 오픈소스로 공개하여 트레이더들이 기능을 검토하고 검증할 수 있도록 했습니다. 작성자에게 찬사를 보냅니다! 이 코드는 무료로 사용할 수 있지만, 코드를 재게시하는 경우 하우스 룰이 적용된다는 점을 기억하세요.
면책사항
해당 정보와 게시물은 금융, 투자, 트레이딩 또는 기타 유형의 조언이나 권장 사항으로 간주되지 않으며, 트레이딩뷰에서 제공하거나 보증하는 것이 아닙니다. 자세한 내용은 이용 약관을 참조하세요.