OPEN-SOURCE SCRIPT
Window Periods
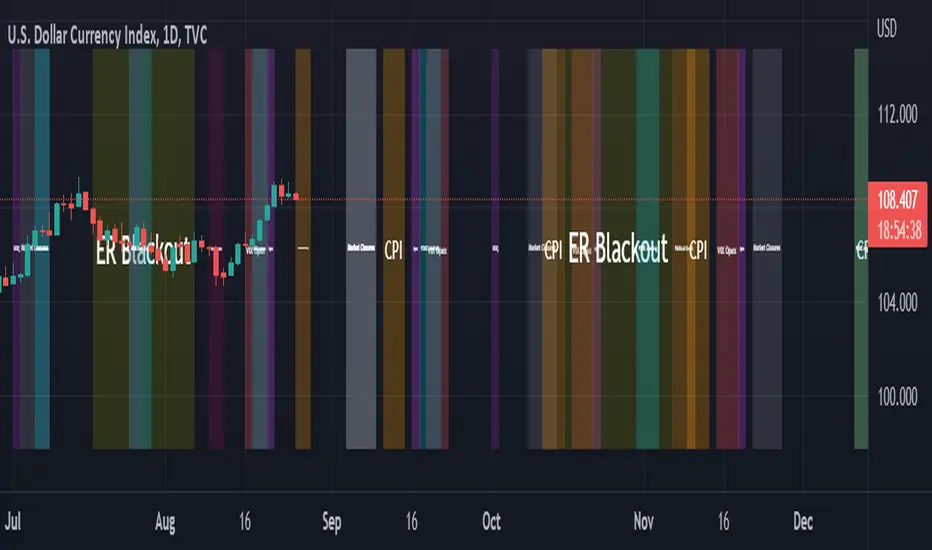
// Work in progress.. visualize event windows
// to do:
// - assign sector relevance (add opec events and weight more to commodity typed instruments, whereas revenue forecasts of walmart won't be as relevant to commodities)
// - create weighting onto macro probability valuators
// - create means to store window weight/values in an accessible way so that additional scripts can access this data (post hidden text in window?) or maybe just duplicate arrays elsewhere in additional code (terrible option)
// - correct colors to scale within like types of events (opex the same, rebalancing periods the same, political and financial meeting the same color etc..)
// - find a way to make transfer the timestamps or date strings as const variables usable within functions. v5 sends as series and cannot be converted back making this an overly complicated case instead of a function/library
// - add dates back to 2017 for better referencing
// - convert a number of the variables to inputs so they can be controlled in-chart, such as transparancy, and color of each window period?
오픈 소스 스크립트
트레이딩뷰의 진정한 정신에 따라, 이 스크립트의 작성자는 이를 오픈소스로 공개하여 트레이더들이 기능을 검토하고 검증할 수 있도록 했습니다. 작성자에게 찬사를 보냅니다! 이 코드는 무료로 사용할 수 있지만, 코드를 재게시하는 경우 하우스 룰이 적용된다는 점을 기억하세요.
Tilden
면책사항
해당 정보와 게시물은 금융, 투자, 트레이딩 또는 기타 유형의 조언이나 권장 사항으로 간주되지 않으며, 트레이딩뷰에서 제공하거나 보증하는 것이 아닙니다. 자세한 내용은 이용 약관을 참조하세요.
오픈 소스 스크립트
트레이딩뷰의 진정한 정신에 따라, 이 스크립트의 작성자는 이를 오픈소스로 공개하여 트레이더들이 기능을 검토하고 검증할 수 있도록 했습니다. 작성자에게 찬사를 보냅니다! 이 코드는 무료로 사용할 수 있지만, 코드를 재게시하는 경우 하우스 룰이 적용된다는 점을 기억하세요.
Tilden
면책사항
해당 정보와 게시물은 금융, 투자, 트레이딩 또는 기타 유형의 조언이나 권장 사항으로 간주되지 않으며, 트레이딩뷰에서 제공하거나 보증하는 것이 아닙니다. 자세한 내용은 이용 약관을 참조하세요.