OPEN-SOURCE SCRIPT
M2 Global Liquidity Index [Custom Offsets]
M2 Global Liquidity Index [Custom Offsets]
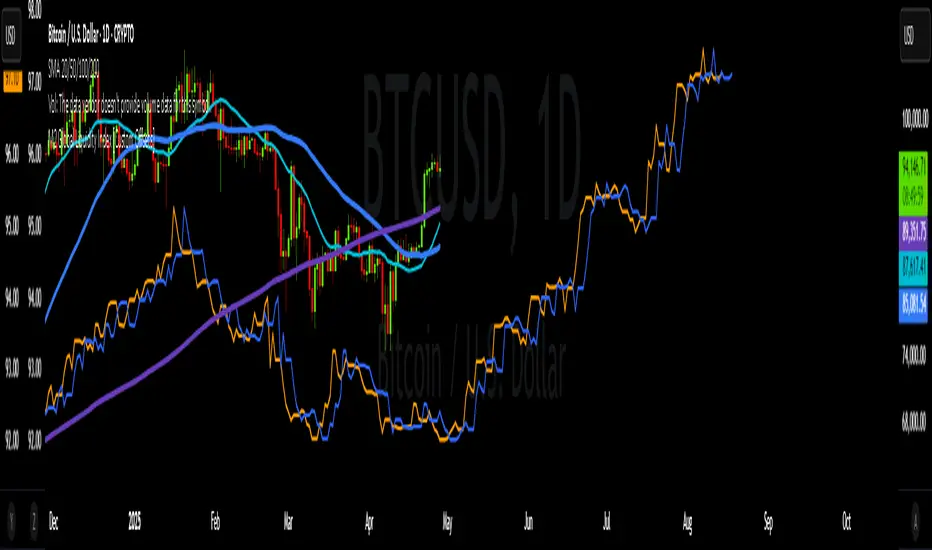
Plots the global M2 money supply alongside price, with two user-configurable forward shifts to help you anticipate macro-driven moves in BTC (or any asset).
Key Features
Current M2 Index (no offset)
Offset A — shift M2 forward by N days (default 78)
Offset B — shift M2 forward by M days (default 109)
Extended Currencies toggle adds 9 additional central banks (CHF, CAD, INR, RUB, BRL, KRW, MXN, ZAR)
All lines share the left-hand axis and scale to trillions
Inputs
Offset A (days): integer ≥ 0 (default 78)
Offset B (days): integer ≥ 0 (default 109)
Include extended currencies?: on/off
How to Use
Add the indicator to any chart (overlay mode).
In Settings → Inputs, enter your desired lead times for Offset A and Offset B.
Toggle extended currencies if you need a broader “global liquidity” view.
Watch how price action (e.g. BTC) tracks the shifted M2 lines to spot potential turning points.
Why It Matters
Changes in money supply often lead risk assets by several weeks to months. This tool makes it easy to visualize and test those correlations directly on your favorite timeframe.
오픈 소스 스크립트
트레이딩뷰의 진정한 정신에 따라, 이 스크립트의 작성자는 이를 오픈소스로 공개하여 트레이더들이 기능을 검토하고 검증할 수 있도록 했습니다. 작성자에게 찬사를 보냅니다! 이 코드는 무료로 사용할 수 있지만, 코드를 재게시하는 경우 하우스 룰이 적용된다는 점을 기억하세요.
면책사항
해당 정보와 게시물은 금융, 투자, 트레이딩 또는 기타 유형의 조언이나 권장 사항으로 간주되지 않으며, 트레이딩뷰에서 제공하거나 보증하는 것이 아닙니다. 자세한 내용은 이용 약관을 참조하세요.
오픈 소스 스크립트
트레이딩뷰의 진정한 정신에 따라, 이 스크립트의 작성자는 이를 오픈소스로 공개하여 트레이더들이 기능을 검토하고 검증할 수 있도록 했습니다. 작성자에게 찬사를 보냅니다! 이 코드는 무료로 사용할 수 있지만, 코드를 재게시하는 경우 하우스 룰이 적용된다는 점을 기억하세요.
면책사항
해당 정보와 게시물은 금융, 투자, 트레이딩 또는 기타 유형의 조언이나 권장 사항으로 간주되지 않으며, 트레이딩뷰에서 제공하거나 보증하는 것이 아닙니다. 자세한 내용은 이용 약관을 참조하세요.