PROTECTED SOURCE SCRIPT
Absolute Range 1/2 - Histogram Style - Alternating 7 Bars
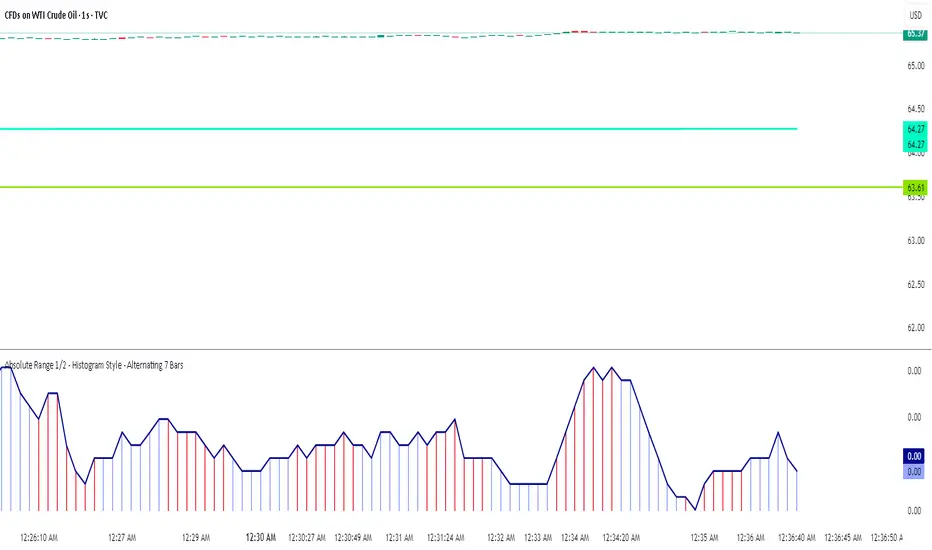
Absolute Range 1/2 - Histogram Style with Alternating 7-Bar Colors
This indicator calculates the 9-period simple moving average of the daily range (high minus low) and plots half of this value as a histogram and a line for easy visual tracking of range volatility.
To enhance readability, the histogram bars alternate colors every 7 bars — grouping the bars in blocks of seven with distinct colors. This makes it easier to observe range patterns and changes over time.
Features:
Smooths range data using SMA(9)
Plots half the average range as histogram bars and a line overlay
Alternates histogram bar colors every 7 bars dynamically
Clean, minimalistic design suitable for identifying volatility trends
보호된 스크립트입니다
이 스크립트는 비공개 소스로 게시됩니다. 하지만 이를 자유롭게 제한 없이 사용할 수 있습니다 – 자세한 내용은 여기에서 확인하세요.
면책사항
해당 정보와 게시물은 금융, 투자, 트레이딩 또는 기타 유형의 조언이나 권장 사항으로 간주되지 않으며, 트레이딩뷰에서 제공하거나 보증하는 것이 아닙니다. 자세한 내용은 이용 약관을 참조하세요.
보호된 스크립트입니다
이 스크립트는 비공개 소스로 게시됩니다. 하지만 이를 자유롭게 제한 없이 사용할 수 있습니다 – 자세한 내용은 여기에서 확인하세요.
면책사항
해당 정보와 게시물은 금융, 투자, 트레이딩 또는 기타 유형의 조언이나 권장 사항으로 간주되지 않으며, 트레이딩뷰에서 제공하거나 보증하는 것이 아닙니다. 자세한 내용은 이용 약관을 참조하세요.