OPEN-SOURCE SCRIPT
High and Low of Last 5 Trading Days
### Indicator Description: High and Low of Last 5 Trading Days
**Indicator Name:** High and Low of Last 5 Trading Days
**Purpose:**
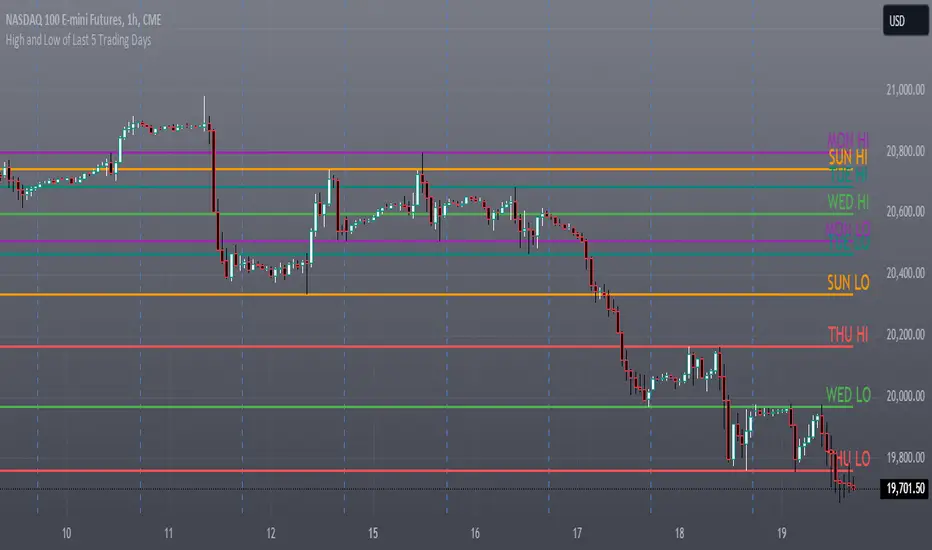
This indicator plots the high and low levels for each of the last 5 trading days on your TradingView chart. It helps traders to visualize important price levels from the recent trading history, which can act as potential support and resistance levels.
**Features:**
1. **Daily High and Low Levels:** Plots the high and low prices for each of the last 5 trading days.
2. **Unique Colors for Each Day:** Each trading day's high and low levels are color-coded uniquely for easy identification.
3. **Solid Lines:** The high and low levels are represented by solid lines for better visibility.
4. **Day Labels:** The lines are labeled with the corresponding day and whether it is a high or low level (e.g., "MON HI", "MON LO").
5. **Dynamic Updates:** The levels and labels are updated at the beginning of each new day, ensuring that the most recent 5 days are always displayed.
**Usage:**
- **Support and Resistance:** Identify key support and resistance levels based on the previous 5 days' high and low prices.
- **Trend Analysis:** Determine the recent price trend by observing the relative positioning of the daily high and low levels.
- **Price Action:** Analyze price action around these levels to make informed trading decisions.
**Configuration:**
- The indicator does not require any user input. It automatically calculates and displays the high and low levels for the past 5 trading days.
**Visual Elements:**
- **Lines:** Solid lines in different colors (red, green, teal, purple, orange) represent the high and low levels.
- **Labels:** Text labels at the right end of each line indicate the day and whether it is a high or low level (e.g., "MON HI", "TUE LO").
This indicator provides a clear visual representation of significant price levels from the recent trading history, aiding traders in their technical analysis and decision-making process.
**Indicator Name:** High and Low of Last 5 Trading Days
**Purpose:**
This indicator plots the high and low levels for each of the last 5 trading days on your TradingView chart. It helps traders to visualize important price levels from the recent trading history, which can act as potential support and resistance levels.
**Features:**
1. **Daily High and Low Levels:** Plots the high and low prices for each of the last 5 trading days.
2. **Unique Colors for Each Day:** Each trading day's high and low levels are color-coded uniquely for easy identification.
3. **Solid Lines:** The high and low levels are represented by solid lines for better visibility.
4. **Day Labels:** The lines are labeled with the corresponding day and whether it is a high or low level (e.g., "MON HI", "MON LO").
5. **Dynamic Updates:** The levels and labels are updated at the beginning of each new day, ensuring that the most recent 5 days are always displayed.
**Usage:**
- **Support and Resistance:** Identify key support and resistance levels based on the previous 5 days' high and low prices.
- **Trend Analysis:** Determine the recent price trend by observing the relative positioning of the daily high and low levels.
- **Price Action:** Analyze price action around these levels to make informed trading decisions.
**Configuration:**
- The indicator does not require any user input. It automatically calculates and displays the high and low levels for the past 5 trading days.
**Visual Elements:**
- **Lines:** Solid lines in different colors (red, green, teal, purple, orange) represent the high and low levels.
- **Labels:** Text labels at the right end of each line indicate the day and whether it is a high or low level (e.g., "MON HI", "TUE LO").
This indicator provides a clear visual representation of significant price levels from the recent trading history, aiding traders in their technical analysis and decision-making process.
오픈 소스 스크립트
트레이딩뷰의 진정한 정신에 따라, 이 스크립트의 작성자는 이를 오픈소스로 공개하여 트레이더들이 기능을 검토하고 검증할 수 있도록 했습니다. 작성자에게 찬사를 보냅니다! 이 코드는 무료로 사용할 수 있지만, 코드를 재게시하는 경우 하우스 룰이 적용된다는 점을 기억하세요.
면책사항
해당 정보와 게시물은 금융, 투자, 트레이딩 또는 기타 유형의 조언이나 권장 사항으로 간주되지 않으며, 트레이딩뷰에서 제공하거나 보증하는 것이 아닙니다. 자세한 내용은 이용 약관을 참조하세요.
오픈 소스 스크립트
트레이딩뷰의 진정한 정신에 따라, 이 스크립트의 작성자는 이를 오픈소스로 공개하여 트레이더들이 기능을 검토하고 검증할 수 있도록 했습니다. 작성자에게 찬사를 보냅니다! 이 코드는 무료로 사용할 수 있지만, 코드를 재게시하는 경우 하우스 룰이 적용된다는 점을 기억하세요.
면책사항
해당 정보와 게시물은 금융, 투자, 트레이딩 또는 기타 유형의 조언이나 권장 사항으로 간주되지 않으며, 트레이딩뷰에서 제공하거나 보증하는 것이 아닙니다. 자세한 내용은 이용 약관을 참조하세요.