OPEN-SOURCE SCRIPT
BB phases
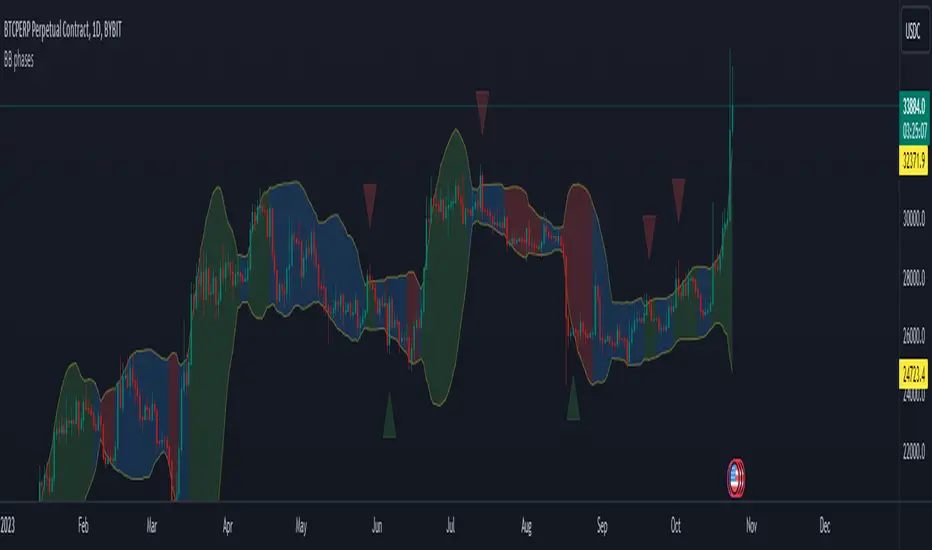
This indicator is designed to visually represent different market phases based on Bollinger Bands (BB) and provide insights into potential bullish and bearish signals. Let's break down what the indicator does:
The indicator smoothly transitions from the "squeeze" phase to "bullish" or "bearish" phases based on specific price conditions. Here's a more detailed explanation of how this transition occurs:
Another feature of the indicator is to display bearish/bullish triangles when the price reintegrate the bollinger bands after it previously breaked it. For example if the price closes below the lower BB and then the next candle in above the lower BB, a bullish triangle will be displayed.
The indicator smoothly transitions from the "squeeze" phase to "bullish" or "bearish" phases based on specific price conditions. Here's a more detailed explanation of how this transition occurs:
- Squeeze Phase: The "squeeze" phase is identified when the closing price is within the range between the upper Bollinger Band (upper BB) and the lower Bollinger Band (lower BB).
- Transition to Bullish Phase: The transition from "squeeze" to "bullish" phase occurs when the price closes above the upper BB. The bullish phase will last while the price hasn't closed below the middle BB.
- Transition to Bearish Phase: Conversely, the transition from "squeeze" to "bearish" phase occurs when the price closes below the lower BB. The bearish phase will last while the price hasn't closed above the middle BB.
Another feature of the indicator is to display bearish/bullish triangles when the price reintegrate the bollinger bands after it previously breaked it. For example if the price closes below the lower BB and then the next candle in above the lower BB, a bullish triangle will be displayed.
오픈 소스 스크립트
트레이딩뷰의 진정한 정신에 따라, 이 스크립트의 작성자는 이를 오픈소스로 공개하여 트레이더들이 기능을 검토하고 검증할 수 있도록 했습니다. 작성자에게 찬사를 보냅니다! 이 코드는 무료로 사용할 수 있지만, 코드를 재게시하는 경우 하우스 룰이 적용된다는 점을 기억하세요.
면책사항
해당 정보와 게시물은 금융, 투자, 트레이딩 또는 기타 유형의 조언이나 권장 사항으로 간주되지 않으며, 트레이딩뷰에서 제공하거나 보증하는 것이 아닙니다. 자세한 내용은 이용 약관을 참조하세요.
오픈 소스 스크립트
트레이딩뷰의 진정한 정신에 따라, 이 스크립트의 작성자는 이를 오픈소스로 공개하여 트레이더들이 기능을 검토하고 검증할 수 있도록 했습니다. 작성자에게 찬사를 보냅니다! 이 코드는 무료로 사용할 수 있지만, 코드를 재게시하는 경우 하우스 룰이 적용된다는 점을 기억하세요.
면책사항
해당 정보와 게시물은 금융, 투자, 트레이딩 또는 기타 유형의 조언이나 권장 사항으로 간주되지 않으며, 트레이딩뷰에서 제공하거나 보증하는 것이 아닙니다. 자세한 내용은 이용 약관을 참조하세요.