INVITE-ONLY SCRIPT
Heatmap - Multi-Timeframe Indicators - Alerts
Heatmap - Multi-Timeframe Indicators - Alerts
▪ Main features:
- 19 Timeframes: 1m, 3m, 5m, 10m, 15m, 30m, 45m, 1h, 2h, 3h, 4h, 5h, 6h, 8h, 10h, 12h, 1D, 1W, 1M
- 6 indicators per timeframe
- choose specific timeframes for indicators (example - 1 hour)
- or choose specific timeframe ranges (example - 1 hour to 1 month)
The general idea is that the higher timeframe signals are stronger than the lower timeframe ones.
When a trend is starting, it is first visible on the lower timeframes.
The more time passes, the more the trend propagates through higher timeframes.
The default settings are meant to show all the available features. You may fine-tune it to your specific needs.
How to choose the timeframe for the chart: use the lowest of the choosen timeframes for indicators.
If the heatmap doesn't display correctly on your device, you may check the Heatmap Theme 🎨 setting.
It doesn't repaint.
"Repaint" version available though - good to check the past history, but very bad for real-time analysis.
▪ Indicators used for trend detection
1. MACD Cross
2. Stochastic Cross
3. Stochastic Cross and Overbought or Oversold
4. Moving Average
5. Parabolic SAR
6. Heikin Ashi
▪ Find the best Heatmap settings with the Strategy Tester version.
The signals generated by the Heatmap are considered to be valid at the bar open.
The Strategy Tester, however, uses the bar close in its calculations.
Therefore, the results may seem to be worse than they can be.
The Profitability, Profit Factor and other stats should be taken into consideration relatively to other configurations of the same Heatmap.
▪ Using a score system to consider a change in trend valid.
Example: consider the signal valid if 65% or more of all indicators (max 6) among all timeframes (max 19) hint at a change in trend.
The % percent value can be inserted in settings.
When using the default settings or when all timeframes and indicators are activated,
the ratio of 100% downtrend or 100% uptrend may be less occuring. Adjust accordingly.
The signals across timeframes and indicators are aggregated to show simple entry and exit signals.
▪ Combined Alerts, to be set to fire once per bar open:
Pine Script®
▪ Note: The initial load may be slow. If something doesn't seem to work, you can try the following:
- wait more time for it to load
- hide & show or remove & add back to chart
- don't add the indicator to chart multiple times in a short amount of time, as you may be rate limited
▪ Related Studies:
- Heatmap - Multi-Timeframe Indicators - Strategy Tester
- Risk Management System (Stop Loss, Take Profit, Trailing Stop Loss, Trailing Take Profit) - it can be connected to Heatmap - Multi-Timeframe Indicators - Alerts
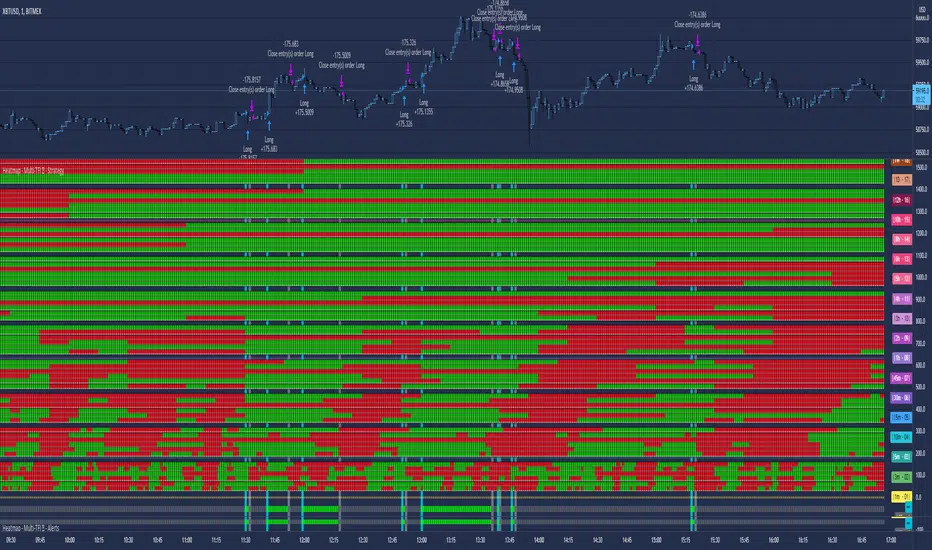
▪ Layout example:

▪ Main features:
- 19 Timeframes: 1m, 3m, 5m, 10m, 15m, 30m, 45m, 1h, 2h, 3h, 4h, 5h, 6h, 8h, 10h, 12h, 1D, 1W, 1M
- 6 indicators per timeframe
- choose specific timeframes for indicators (example - 1 hour)
- or choose specific timeframe ranges (example - 1 hour to 1 month)
The general idea is that the higher timeframe signals are stronger than the lower timeframe ones.
When a trend is starting, it is first visible on the lower timeframes.
The more time passes, the more the trend propagates through higher timeframes.
The default settings are meant to show all the available features. You may fine-tune it to your specific needs.
How to choose the timeframe for the chart: use the lowest of the choosen timeframes for indicators.
If the heatmap doesn't display correctly on your device, you may check the Heatmap Theme 🎨 setting.
It doesn't repaint.
"Repaint" version available though - good to check the past history, but very bad for real-time analysis.
▪ Indicators used for trend detection
1. MACD Cross
2. Stochastic Cross
3. Stochastic Cross and Overbought or Oversold
4. Moving Average
5. Parabolic SAR
6. Heikin Ashi
▪ Find the best Heatmap settings with the Strategy Tester version.
The signals generated by the Heatmap are considered to be valid at the bar open.
The Strategy Tester, however, uses the bar close in its calculations.
Therefore, the results may seem to be worse than they can be.
The Profitability, Profit Factor and other stats should be taken into consideration relatively to other configurations of the same Heatmap.
▪ Using a score system to consider a change in trend valid.
Example: consider the signal valid if 65% or more of all indicators (max 6) among all timeframes (max 19) hint at a change in trend.
The % percent value can be inserted in settings.
When using the default settings or when all timeframes and indicators are activated,
the ratio of 100% downtrend or 100% uptrend may be less occuring. Adjust accordingly.
The signals across timeframes and indicators are aggregated to show simple entry and exit signals.
▪ Combined Alerts, to be set to fire once per bar open:
0 - 📈 Long! - Heatmap - Multi-TFI
0 - 📈 Short! - Heatmap - Multi-TFI
0 - 📈 Long Exit! - Heatmap - Multi-TFI
0 - 📈 Short Exit! - Heatmap - Multi-TFI
1 *** BUY or SELL (single alert) ***
1 *** Entries or Exits (single alert) ***
▪ Note: The initial load may be slow. If something doesn't seem to work, you can try the following:
- wait more time for it to load
- hide & show or remove & add back to chart
- don't add the indicator to chart multiple times in a short amount of time, as you may be rate limited
▪ Related Studies:
- Heatmap - Multi-Timeframe Indicators - Strategy Tester
- Risk Management System (Stop Loss, Take Profit, Trailing Stop Loss, Trailing Take Profit) - it can be connected to Heatmap - Multi-Timeframe Indicators - Alerts
▪ Layout example:
초대 전용 스크립트
이 스크립트는 작성자가 승인한 사용자만 접근할 수 있습니다. 사용하려면 요청 후 승인을 받아야 하며, 일반적으로 결제 후에 허가가 부여됩니다. 자세한 내용은 아래 작성자의 안내를 따르거나 KryptoNight에게 직접 문의하세요.
트레이딩뷰는 스크립트의 작동 방식을 충분히 이해하고 작성자를 완전히 신뢰하지 않는 이상, 해당 스크립트에 비용을 지불하거나 사용하는 것을 권장하지 않습니다. 커뮤니티 스크립트에서 무료 오픈소스 대안을 찾아보실 수도 있습니다.
작성자 지시 사항
- follow on TradingView for updates
- join my Discord server for support: https://discord.gg/rjdca8S
Join the Discord Server for more info about the published tools.
discord.io/CryptoWorld
a Discord bot for Charting (TradingView and Heatmaps) is available
🟣 If you like any of my Invite-Only Tools, let me know
(DM or Discord for inquiries)
discord.io/CryptoWorld
a Discord bot for Charting (TradingView and Heatmaps) is available
🟣 If you like any of my Invite-Only Tools, let me know
(DM or Discord for inquiries)
면책사항
해당 정보와 게시물은 금융, 투자, 트레이딩 또는 기타 유형의 조언이나 권장 사항으로 간주되지 않으며, 트레이딩뷰에서 제공하거나 보증하는 것이 아닙니다. 자세한 내용은 이용 약관을 참조하세요.