OPEN-SOURCE SCRIPT
업데이트됨 Perfect RSI

Overview:
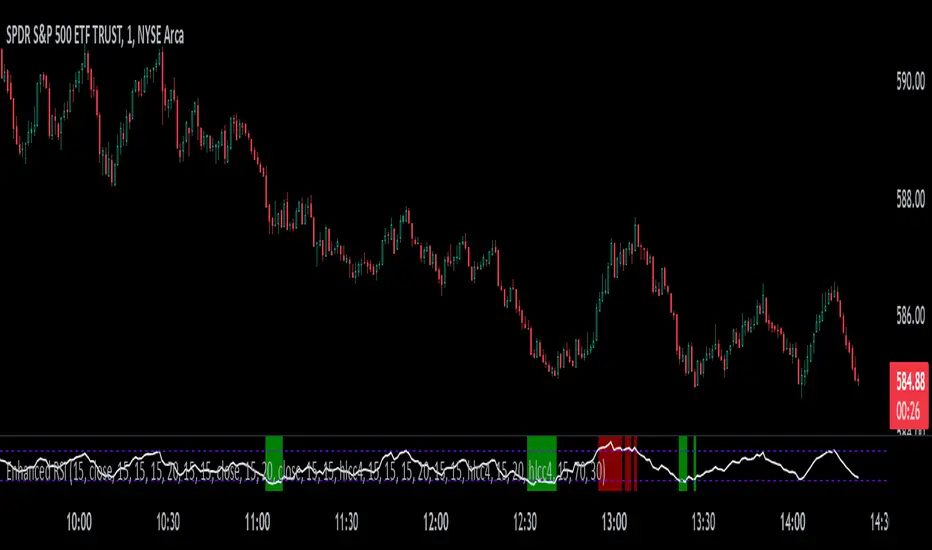
The "Enhanced RSI" is a comprehensive TradingView indicator designed to provide traders with a nuanced and detailed analysis of market conditions using the Relative Strength Index (RSI). It amalgamates various RSI calculation methods to offer a more robust and adaptable approach to technical analysis.
Originality:
This script is unique in its synthesis of multiple RSI calculation techniques, including Regular RSI, Dynamic RSI, DMI RSI, Wilder's RSI, TSI RSI, Momentum RSI, and PPO RSI. By combining these methods, the script creates a distinctive and versatile tool for traders seeking a holistic view of RSI dynamics.
How It Works:
Diverse RSI Calculations:
Regular RSI: Calculates standard RSI with user-defined length and source.
Dynamic RSI: Adjusts RSI dynamically based on price movement direction.
DMI RSI: Uses Directional Movement Index for RSI calculation.
Wilder's RSI: Implements Wilder's smoothing technique for RSI.
TSI RSI: Utilizes True Strength Index for RSI calculation.
Momentum RSI: Calculates RSI based on momentum.
PPO RSI: Applies Percentage Price Oscillator for RSI calculation.
Composite RSI:
Combines the individual RSIs into three composite indices (RSI1, RSI2, RSI) using a weighted average approach.
Dynamic Level Adjustment:
Uses the correlation coefficient to dynamically adjust overbought and oversold levels, enhancing adaptability to market changes.
Visualization and Background Coloring:
Visualizes overbought and oversold zones on the chart.
Adjusts background color based on these conditions for clearer interpretation.
How to Use:
Installation:
Copy and paste the script into the Pine Editor on TradingView.
Adjust parameters as needed.
Analysis:
Utilize the "Enhanced RSI" as a comprehensive analysis tool for RSI dynamics.
Consider it as a confirmation tool alongside other technical indicators.
Customization:
Experiment with different RSI lengths and methods to align with your trading strategy.
Backtest the script to validate its effectiveness.
Considerations:
Complexity:
The script is sophisticated; users are advised to understand each calculation method before reliance.
Parameter Sensitivity:
Effectiveness may vary based on chosen parameters; thorough backtesting and parameter optimization are recommended.
릴리즈 노트
- Introduces more RSI variations like **Dynamic RSI**, **TSI RSI**, and **PPO RSI**, which are not present in Script 1. - Averages multiple RSIs (`RSI1` and `RSI2`) to calculate a final **blended RSI** for improved accuracy.
- Uses the **correlation coefficient (CC)** to adjust overbought and oversold levels dynamically, instead of fixed levels.
- Applies a **background color** to visually highlight when RSI enters overbought/oversold zones.
- Includes **alert conditions** for overbought and oversold zones.
- Features multiple input parameters for fine-tuning each RSI variant, adding complexity and customization.
- Combines the results of **six RSI calculations** into a final composite RSI, compared to fewer RSI inputs in Script 1.
- Adjusts RSI behavior using a **correlation threshold**, adding adaptability to market conditions.
- Groups input parameters and calculations by RSI type for improved modularity and organization.
오픈 소스 스크립트
트레이딩뷰의 진정한 정신에 따라, 이 스크립트의 작성자는 이를 오픈소스로 공개하여 트레이더들이 기능을 검토하고 검증할 수 있도록 했습니다. 작성자에게 찬사를 보냅니다! 이 코드는 무료로 사용할 수 있지만, 코드를 재게시하는 경우 하우스 룰이 적용된다는 점을 기억하세요.
면책사항
해당 정보와 게시물은 금융, 투자, 트레이딩 또는 기타 유형의 조언이나 권장 사항으로 간주되지 않으며, 트레이딩뷰에서 제공하거나 보증하는 것이 아닙니다. 자세한 내용은 이용 약관을 참조하세요.
오픈 소스 스크립트
트레이딩뷰의 진정한 정신에 따라, 이 스크립트의 작성자는 이를 오픈소스로 공개하여 트레이더들이 기능을 검토하고 검증할 수 있도록 했습니다. 작성자에게 찬사를 보냅니다! 이 코드는 무료로 사용할 수 있지만, 코드를 재게시하는 경우 하우스 룰이 적용된다는 점을 기억하세요.
면책사항
해당 정보와 게시물은 금융, 투자, 트레이딩 또는 기타 유형의 조언이나 권장 사항으로 간주되지 않으며, 트레이딩뷰에서 제공하거나 보증하는 것이 아닙니다. 자세한 내용은 이용 약관을 참조하세요.