INVITE-ONLY SCRIPT
업데이트됨 ES Bundle
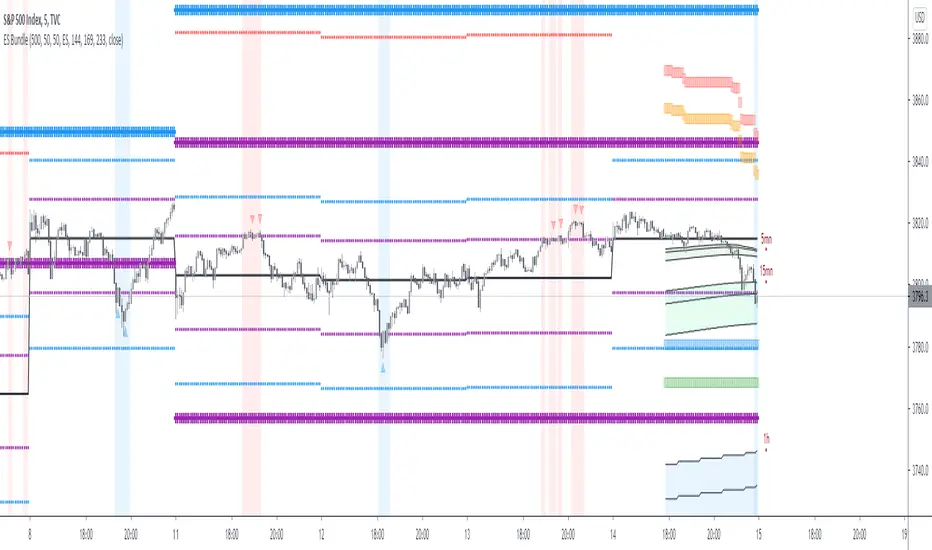
This script is for ES ( E Mini futur or MES) day trading only.
It is a simulation of marker behavior resulting in 2 kind of level:
Oversold and overbougth level:
* It is square shape: orange and red are 1st and 2nd level of Overbougth ( high probability to down of 16 points if you have a bearish divergence of momemtum above these levels)
* It is square shape:blue and green are 1st and 2nd level of Overbougth ( high probability to upof 16 points if you have a bullish divergence of momemtum above these levels)
*In case of crazy market rend (10% of the time, only small reversal is expected but more often than not momemtum will not plot divergence)
Level of support and resistance
*There is 2 size ( cross shaped pattern), the small is for daily timeframe and the large is for weekly timeframe
*Purple line is the fiest and weakest area of resistance or support
*Blue cross is and interesting level, if momemtum plot divergence above blue resistance or below bull support it is time to search for short or long respectivly
*Red line is when crazy market happen, every divergence above or below red line is a major trade reversal
Obviously if you are on support level + under oversold zone it is the best setup to long and vice versa
릴리즈 노트
Update :*Adding Bundle for GC, CL, SPX, BTC and VIX
* Adding FIlter for signal ( red and blue triangle)
*All signal must be filtered by divergence on momemtum reader (see indicator on tradingview)
초대 전용 스크립트
이 스크립트는 작성자가 승인한 사용자만 접근할 수 있습니다. 사용하려면 요청 후 승인을 받아야 하며, 일반적으로 결제 후에 허가가 부여됩니다. 자세한 내용은 아래 작성자의 안내를 따르거나 nonobdx에게 직접 문의하세요.
트레이딩뷰는 스크립트의 작동 방식을 충분히 이해하고 작성자를 완전히 신뢰하지 않는 이상, 해당 스크립트에 비용을 지불하거나 사용하는 것을 권장하지 않습니다. 커뮤니티 스크립트에서 무료 오픈소스 대안을 찾아보실 수도 있습니다.
작성자 지시 사항
Apprendre la méthode:
discord.gg/b7YGtY2
Site internet: marketreader.fr/
Chaine Youtube : youtube.com/channel/UC-a7p8DkfbDM6ONrTzsaErA?view_as=subscriber
discord.gg/b7YGtY2
Site internet: marketreader.fr/
Chaine Youtube : youtube.com/channel/UC-a7p8DkfbDM6ONrTzsaErA?view_as=subscriber
면책사항
해당 정보와 게시물은 금융, 투자, 트레이딩 또는 기타 유형의 조언이나 권장 사항으로 간주되지 않으며, 트레이딩뷰에서 제공하거나 보증하는 것이 아닙니다. 자세한 내용은 이용 약관을 참조하세요.