OPEN-SOURCE SCRIPT
업데이트됨 Cash Cycle Band

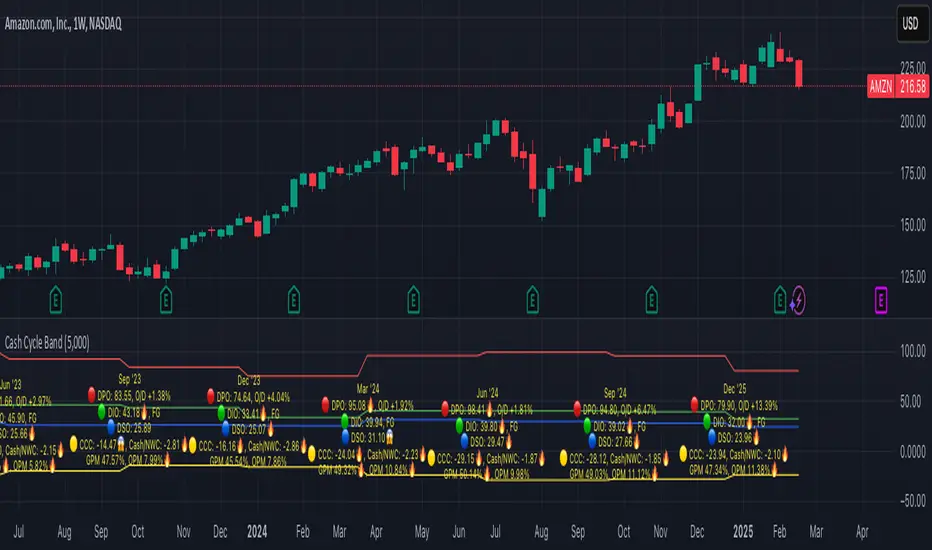
Cash cycle band shows the number of days and the profit margin compared to the previous period (it does not indicate how profitable the company is, but how well it is managed).
Cash cycle band consists of 6 sections:
1. DPO is the days payables outstanding in the "red" followed by O/D which is overdraft or short-term debt (if any) .
2. DIO is the days inventory outstanding in the "green" followed by classified inventory (if any) consists of finished goods. work in process and raw materials.
3. DSO is days sales outstanding in "blue".
4. DWC is days converting working capital to revenue in "orange".
5. CCC is days converting inventory and resources to cash flow in "yellow".
6. GPM is gross profit margin and OPM is operating profit margin.
The "😱" emoji indicates a value if it increases by more than or decreases by less than 20%, e.g.
- DPO, finished goods, work in process, raw materials, GPM, OPM is decreasing.
- O/D, DIO, DSO, DWC, CCC is increasing.
The "🔥" emoji indicates a value if it increases by more than or decreases, e.g.
- DPO, finished goods, work in process, raw materials, GPM, OPM is increasing.
- O/D, DIO, DSO, DWC, CCC is decreasing.
The order of the list depends on the day of each item, the more days more high.
릴리즈 노트
Edit DWC formula from 30 days to 90 days, as same as DPO, DIO, DSO formulas.릴리즈 노트
- Edit DPO using last Revenue instead of previous revenue.- Edit wording to short forms such as Finished to FG, Working to WIP, Raw Mat. to RM.
오픈 소스 스크립트
트레이딩뷰의 진정한 정신에 따라, 이 스크립트의 작성자는 이를 오픈소스로 공개하여 트레이더들이 기능을 검토하고 검증할 수 있도록 했습니다. 작성자에게 찬사를 보냅니다! 이 코드는 무료로 사용할 수 있지만, 코드를 재게시하는 경우 하우스 룰이 적용된다는 점을 기억하세요.
면책사항
해당 정보와 게시물은 금융, 투자, 트레이딩 또는 기타 유형의 조언이나 권장 사항으로 간주되지 않으며, 트레이딩뷰에서 제공하거나 보증하는 것이 아닙니다. 자세한 내용은 이용 약관을 참조하세요.
오픈 소스 스크립트
트레이딩뷰의 진정한 정신에 따라, 이 스크립트의 작성자는 이를 오픈소스로 공개하여 트레이더들이 기능을 검토하고 검증할 수 있도록 했습니다. 작성자에게 찬사를 보냅니다! 이 코드는 무료로 사용할 수 있지만, 코드를 재게시하는 경우 하우스 룰이 적용된다는 점을 기억하세요.
면책사항
해당 정보와 게시물은 금융, 투자, 트레이딩 또는 기타 유형의 조언이나 권장 사항으로 간주되지 않으며, 트레이딩뷰에서 제공하거나 보증하는 것이 아닙니다. 자세한 내용은 이용 약관을 참조하세요.