OPEN-SOURCE SCRIPT
ChillLax Relative Strength Line with NewHigh NewLow Blue Dot
This is similar to the IBD MarketSurge (MarketSmith) Blue Dot:
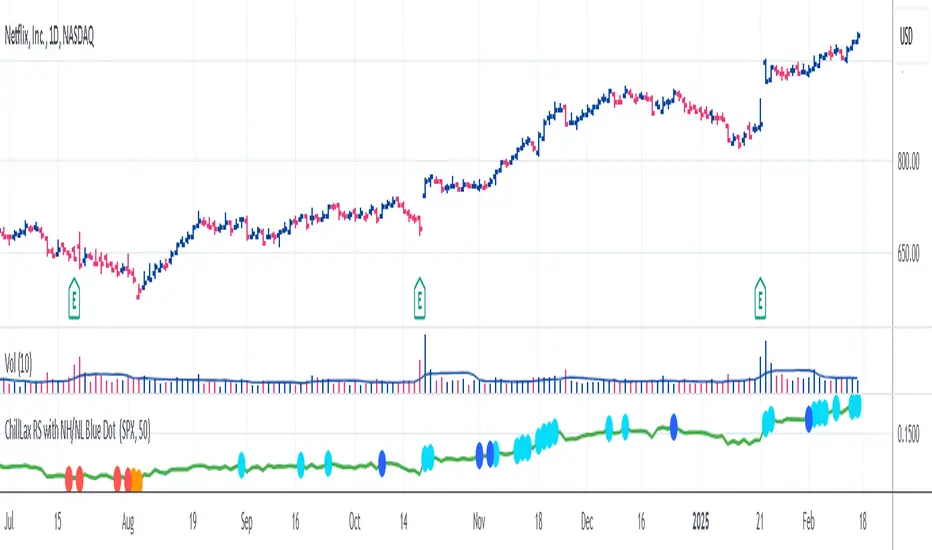
This plots the Relative Strength line vs. an index (default index is SPX), with a Dot when the RS line is hitting a New High.
If the RS hits a New High over the past X bars (default is 50), it shows a Light Blue (user definable) Dot on the RS line, if RS hits New High before the instrument hits New High, it shows a bigger/darker Blue Dot. Reverse for New Lows (orange for RS NL, Red for RS NL before Price NL)
This Dot is similar to the IBD Marketsurge RS New High Blue Dot, this indicator shows all the previous dots (MarketSurge shows only the last one). This on, unlike IBD, also shows RS New Lows. This one distinguishes RS NH before Price NH, and RS NL before Price NL. Lastly, IBD's lookback period is 52 week, here it is default to 50 days, but it is changeable.
오픈 소스 스크립트
트레이딩뷰의 진정한 정신에 따라, 이 스크립트의 작성자는 이를 오픈소스로 공개하여 트레이더들이 기능을 검토하고 검증할 수 있도록 했습니다. 작성자에게 찬사를 보냅니다! 이 코드는 무료로 사용할 수 있지만, 코드를 재게시하는 경우 하우스 룰이 적용된다는 점을 기억하세요.
면책사항
해당 정보와 게시물은 금융, 투자, 트레이딩 또는 기타 유형의 조언이나 권장 사항으로 간주되지 않으며, 트레이딩뷰에서 제공하거나 보증하는 것이 아닙니다. 자세한 내용은 이용 약관을 참조하세요.
오픈 소스 스크립트
트레이딩뷰의 진정한 정신에 따라, 이 스크립트의 작성자는 이를 오픈소스로 공개하여 트레이더들이 기능을 검토하고 검증할 수 있도록 했습니다. 작성자에게 찬사를 보냅니다! 이 코드는 무료로 사용할 수 있지만, 코드를 재게시하는 경우 하우스 룰이 적용된다는 점을 기억하세요.
면책사항
해당 정보와 게시물은 금융, 투자, 트레이딩 또는 기타 유형의 조언이나 권장 사항으로 간주되지 않으며, 트레이딩뷰에서 제공하거나 보증하는 것이 아닙니다. 자세한 내용은 이용 약관을 참조하세요.