OPEN-SOURCE SCRIPT
업데이트됨 Pivot Point Target Prices [SS]
Hey everyone,
Back with another indicator!
I have been trying to do this indicator for like months (over 6 months). I gave up on it a few times and then finally reapproached it in a different way and was able to get it working successfully!
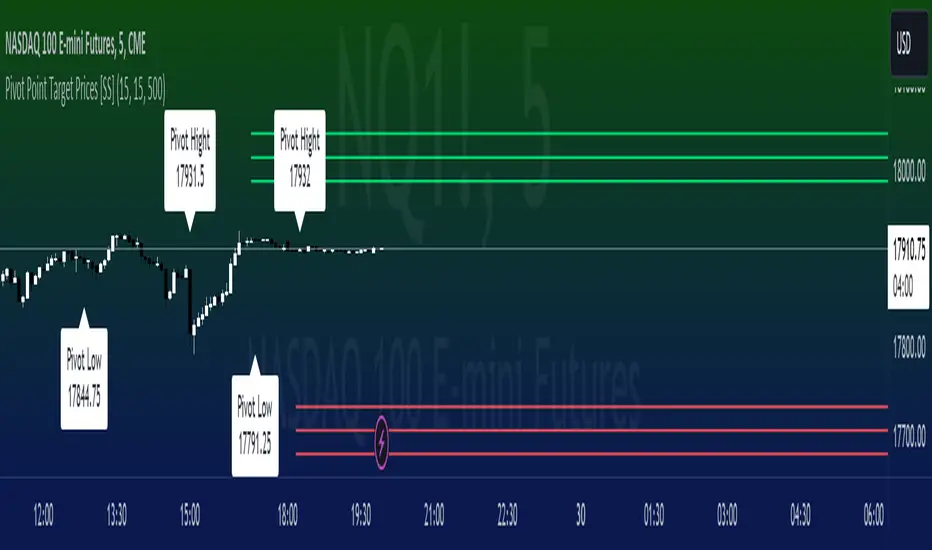
This is the pivot point target price indicator, let's get into how it works!
How it works:
The indicator keeps track of previous pivot highs and lows within your designated lookback timeframe. Using this data, it calculates the average difference between the pivot highs and pivot lows to give you an ATR range.
In addition to this, it tracks the standard deviation of this range. This allows the indicator to give us 3 price targets, 2 standard deviations below the anticipated target, the anticipated target (middle value) and 2 standard deviations above the anticipated target.
Here is a diagram:

I usually only look for the first target, which is the -2 standard deviation below the actual target, but having the added 2 gives some buffer room if a stock is particularly bullish or bearish.
How to use it:
You use this the same way you would pivot points, the only difference is this will show you target ranges to look for on a pivot low or pivot high.
There is some customizability, which I will explain below:
Customize bars: You have the ability to customize left and right bars for your pivot points. I personally like 15 and 15 but I know the most commonly used are 10 and 10.
ATR Length: The ATR Length is defaulted at 500. If you want to tighten up the length and give more conservative targets, you can shorten to between 75 and 150. If you want to be very aggressive with the targets, you can extend to 750 to 1,000.
Toggle on/off labels: You can choose to turn off the pivot labels if you wish.
Important note:
Many pivot indicators will show you pivot levels and use these as support and resistance. This indicator isn't doing that. Its combining ATR and Pivot Points. The ATR gives us the price targets by calculating the average range between pivot highs and pivot lows, and the pivot points are operating as usual.
And that's the indicator!
I hope you enjoy it, like I said it took me forever to get a functioning version of this, so hope you find it helpful!
Safe trades everyone!
Back with another indicator!
I have been trying to do this indicator for like months (over 6 months). I gave up on it a few times and then finally reapproached it in a different way and was able to get it working successfully!
This is the pivot point target price indicator, let's get into how it works!
How it works:
The indicator keeps track of previous pivot highs and lows within your designated lookback timeframe. Using this data, it calculates the average difference between the pivot highs and pivot lows to give you an ATR range.
In addition to this, it tracks the standard deviation of this range. This allows the indicator to give us 3 price targets, 2 standard deviations below the anticipated target, the anticipated target (middle value) and 2 standard deviations above the anticipated target.
Here is a diagram:
I usually only look for the first target, which is the -2 standard deviation below the actual target, but having the added 2 gives some buffer room if a stock is particularly bullish or bearish.
How to use it:
You use this the same way you would pivot points, the only difference is this will show you target ranges to look for on a pivot low or pivot high.
There is some customizability, which I will explain below:
Customize bars: You have the ability to customize left and right bars for your pivot points. I personally like 15 and 15 but I know the most commonly used are 10 and 10.
ATR Length: The ATR Length is defaulted at 500. If you want to tighten up the length and give more conservative targets, you can shorten to between 75 and 150. If you want to be very aggressive with the targets, you can extend to 750 to 1,000.
Toggle on/off labels: You can choose to turn off the pivot labels if you wish.
Important note:
Many pivot indicators will show you pivot levels and use these as support and resistance. This indicator isn't doing that. Its combining ATR and Pivot Points. The ATR gives us the price targets by calculating the average range between pivot highs and pivot lows, and the pivot points are operating as usual.
And that's the indicator!
I hope you enjoy it, like I said it took me forever to get a functioning version of this, so hope you find it helpful!
Safe trades everyone!
릴리즈 노트
A little spelling error that needed to be fixed!오픈 소스 스크립트
트레이딩뷰의 진정한 정신에 따라, 이 스크립트의 작성자는 이를 오픈소스로 공개하여 트레이더들이 기능을 검토하고 검증할 수 있도록 했습니다. 작성자에게 찬사를 보냅니다! 이 코드는 무료로 사용할 수 있지만, 코드를 재게시하는 경우 하우스 룰이 적용된다는 점을 기억하세요.
Get:
- Live Updates,
- Discord access,
- Access to my Proprietary Merlin Software,
- Access to premium indicators,
patreon.com/steversteves
Now on X!
- Live Updates,
- Discord access,
- Access to my Proprietary Merlin Software,
- Access to premium indicators,
patreon.com/steversteves
Now on X!
면책사항
해당 정보와 게시물은 금융, 투자, 트레이딩 또는 기타 유형의 조언이나 권장 사항으로 간주되지 않으며, 트레이딩뷰에서 제공하거나 보증하는 것이 아닙니다. 자세한 내용은 이용 약관을 참조하세요.
오픈 소스 스크립트
트레이딩뷰의 진정한 정신에 따라, 이 스크립트의 작성자는 이를 오픈소스로 공개하여 트레이더들이 기능을 검토하고 검증할 수 있도록 했습니다. 작성자에게 찬사를 보냅니다! 이 코드는 무료로 사용할 수 있지만, 코드를 재게시하는 경우 하우스 룰이 적용된다는 점을 기억하세요.
Get:
- Live Updates,
- Discord access,
- Access to my Proprietary Merlin Software,
- Access to premium indicators,
patreon.com/steversteves
Now on X!
- Live Updates,
- Discord access,
- Access to my Proprietary Merlin Software,
- Access to premium indicators,
patreon.com/steversteves
Now on X!
면책사항
해당 정보와 게시물은 금융, 투자, 트레이딩 또는 기타 유형의 조언이나 권장 사항으로 간주되지 않으며, 트레이딩뷰에서 제공하거나 보증하는 것이 아닙니다. 자세한 내용은 이용 약관을 참조하세요.